

I was scanning for some day trade action, looking on the gap down list (which you can find here) and I saw Allergan (AGN).
The day trading strategy I used to carve out over $100 will be in a future write-up. What likely will interest you however is, while I was day trading this bad boy I noticed a very enticing chart pattern.
Double Tops
I’ve had a few students tell me I teach double tops differently than other organizations and/or companies. My reply has always been “Great! New is part of my last name, so teaching you something new is fun!” I call this a double top because the candle on May 27 tried to make it to the prior high of 170… but just didn’t quite manage it. A black candle was created, showing some light selling pressure. Well, on May 28 (the day I’m writing this), AGN had a nice gap down, continuing the selling pressure. At the end of the day, AGN closed below the neck line of the double top. The neck line (in my opinion) is the lowest point of the pattern. Therefore, I wanted to make sure the stock closed below the May 15 candle.
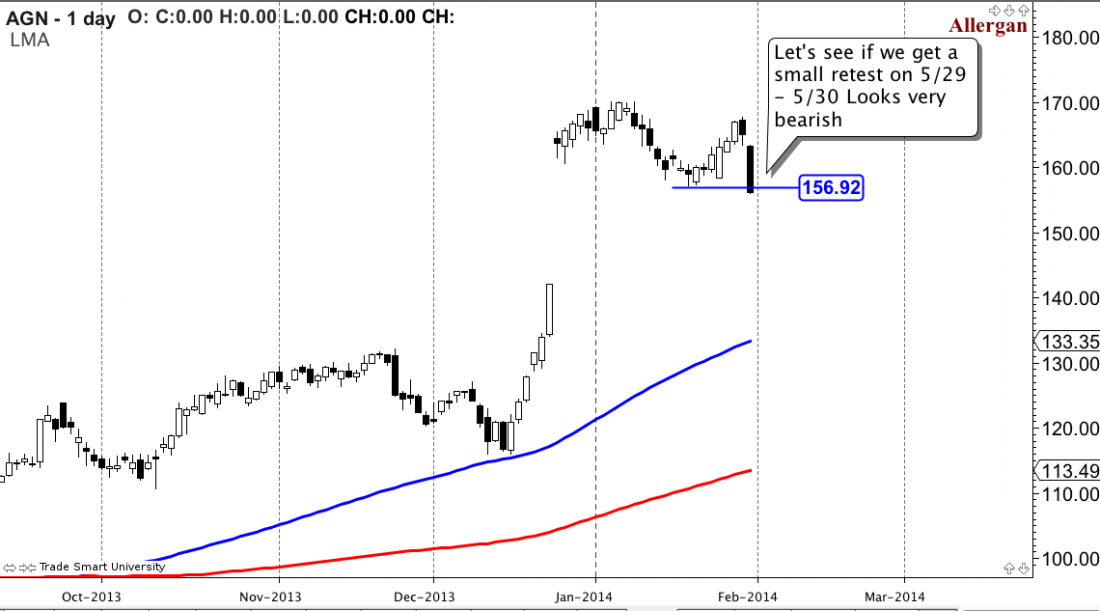
Oftentimes, a double top will ‘retest’ the neck line, which means on May 29 or 30 AGN will likely trade back up between the ranges of 157 – 160. If AGN makes a lower low from there, the double top is confirmed and likely a bearish sell off will take place. Volume increased on 5/28/14 also, giving an additional touch of bearish confirmation.
The 50 exponential moving average is around 149.40. That could be a location to take some profit off the table, but 135 really could be the ultimate target for AGN making this a great risk/reward play.
Keep A Close Eye
My thoughts are, keep a close eye on this monster for the next two to three days after reading this. Keep a bearish outlook and regardless of whether you’re day trading or swing trading, know how much you’re willing to risk and protect yourself. Should be fun!

