

S&P 500: Time to leave the party?
In April of 1720 Sir Isaac Newton, Master of the Royal Mint, Lucasian Professor of Mathematics at Cambridge University, co-inventor of the calculus and author of the Laws of Motion that bear his name (and which dominated the physical sciences for the next three centuries) sold all of his stock in London’s South Sea company.
It was good timing. The stock had risen from about £120 a share (at a time when a family of four could live comfortably on an annual income of £200) to about £300 a share in March. Sir Isaac made a profit of £7,000 on his shares.
Just about what you would expect from one of the most rational men of his time and a father of the Scientific Revolution. But, then something unexpected happened.
The shares of the South Sea company kept going up: to £500 in May to £750 in June to just under £1000 in July.
Sir Isaac, dismayed by his hasty withdrawal and envious of the continuing profits of his friends, climbed back in. And stayed in until the bitter end. He lost almost his entire life savings.
Even a genius can make bad trading decisions, and being a genius won’t save you from yourself.
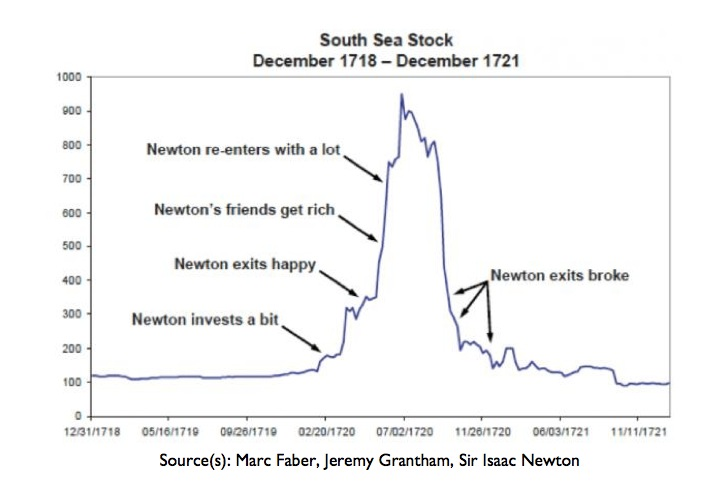
Chart source: Tim Price, Price of Everything blog
If the price graph of the South Sea company looks familiar, it is because it has been repeated innumerable times. It is the cycle of boom and bust every market mania repeats, and it mirrors the psychological journey investors make from greed and euphoria to surrender and despair.
And if a mathematical genius like Newton could not identify exactly where he was on that cycle, why do you think you can?
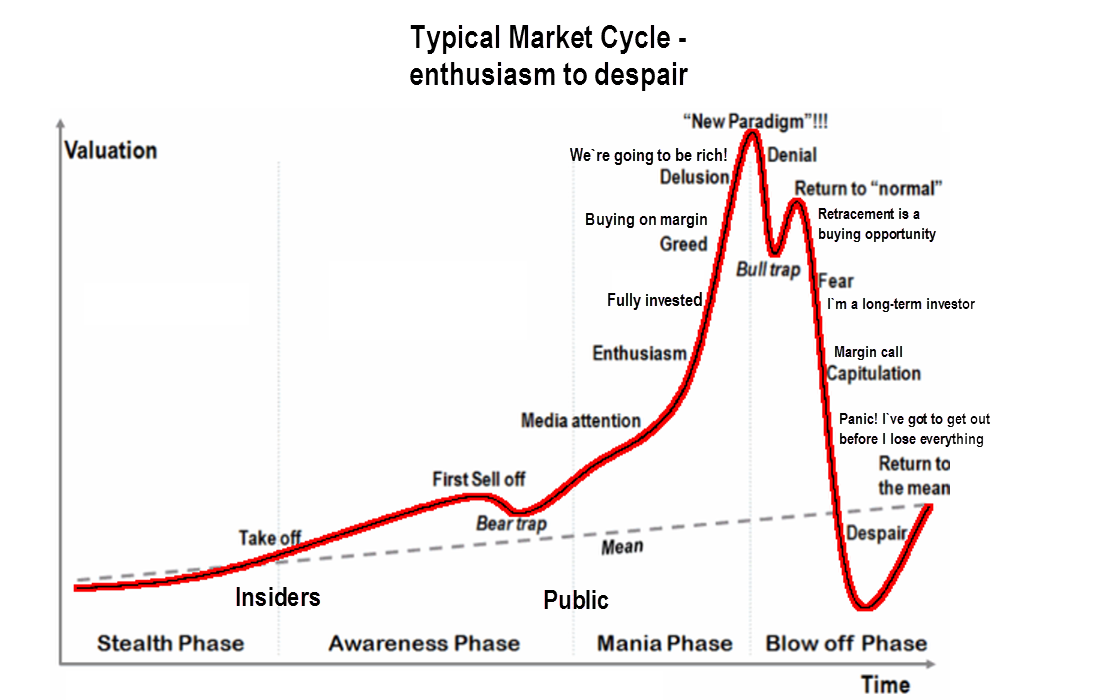
Where Are We Now?
Right now we are on the left shoulder of that chart, somewhere between enthusiasm and delusion. The problem is that we don’t know exactly where, and we don’t know how much further we will go before we reach the top, and the “this time is different” stage.
But we do think there will be some further price advance.
The SPX (the broad large-cap index) closed at 1949.44 last Friday, up 25.87 points, for a net weekly gain of about 1.34% and a new all-time high close. All 10 sectors advanced. So far SPX has gained about 6% from last year’s high.
It has been stalled at about that level for the last two days, but we think the strong upside momentum will continue to bring buyers in on the dips.
The market has been rallying for seven weeks, and the intermediate-term indicator (SST) has been pushed to extremely overbought territory. In addition the index is approaching its long-term resistance level, which overlaps the full target for a short-term symmetrical bullish pattern around 1973.
The resistance should at least pause the price advance in the short term. But it will not stop the rally in the long run unless there is some major bad news. Any short-term pullback is likely to be considered a healthy correction leading to a continuation high movement.
1924 is the June pivot level. Any pullback near it will be bought by new buyers this week. There is a small unfilled gap in the 1941.74-1940.46 area. We should see SPX pull back there early in the week and bounce back up later.
In the short term, as long as SPX doesn’t close below 1920, the uptrend will remain intact.
How To Trade It
How you trade the market at this stage will depend on your investment horizon. Short-term traders will find opportunities on the upside. But long-term investments in this market are risky. There is probably more upside to come. But we don’t know how much more. It is time to be cautious.
= = =
Read Naturus market commentary each Monday morning on TraderPlanet.

