

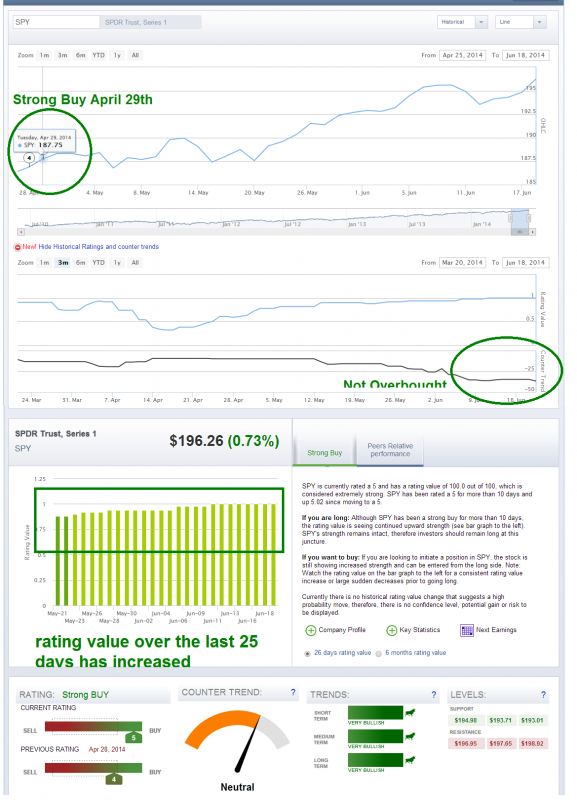
The hardest trade is most often the right trade, as humans are programmed to lose money as traders. That is why we believe so much in a systematic approach to remove emotions. Investing should not be fun or exciting if done right as George Soros receptively says. To note ChartLabPro.com rating strength on the S&P 500 went to a Strong Buy from a Buy on April 29.
As the S&P 500 is now at new historic highs, we wanted to take a look at the most overbought period for the S&P 500 over the last 20 years.
For intermediate- to longer-term investors, it doesn’t pay to move into cash in overbought markets as the data below suggests. We reviewed the most overbought markets in the last 20 years based on our ChartLabPro’s proprietary countertrend model, and here is what we came up with. First, for a reference point, our countertrend reads a maximum of a -1 as being the most exhausted/overbought reading. We have never seen a -1. For those investors who want to manage risk on a shorter-term basis, a reduction to long exposure at a reading of -.72 would be warranted.
Analyzing Overbought Markets
However, the more overbought the market, the more shallow the correction. The countertrend is a quantitative price-reactionary model that helps smooth out the overbought levels and is longer term than those who look at the relative strength index (RSI); and in our opinion a superior way to look at overbought markets than RSI. Currently, the reading is at -36, a rather light metric compared to the top seven most overbought periods. Approaching overbought starts at a -49 and historically, if the S&P 500 makes it to approaching overbought 70% of the time the S&P 500 will reach an overbought level.
• Dec. 15, 1995: Countertrend was -.90.97
• Aug. 5, 1997: Countertrend was -.74.19
• Jan. 16, 2004: Countertrend was -.72.28
• Feb. 14, 2007: Countertrend was -.69.03
• Jan. 14, 2010: Countertrend was -.74.52
• Feb. 2, 2011: Countertrend was -.72.52
• May 25, 2013: Countertrend was -74.42
Here is how the S&P 500 performed 30 days following these readings.
• Dec. 15, 1995: -3.13%
• Aug. 5, 1997: -2.20%
• Jan. 16, 2004: +1.00%
• Feb. 14, 2007: -3.15%
• Jan. 14, 2010: -5.63%
• Feb. 2, 2011: -2.69%
• May 25, 2013: -4.90%
And as we stated above, the current countertrend is -36. As for our rating value on the S&P 500 that grades the strength (as seen in Figure 1), it is currently a strong buy and moved to a strong buy on April 29.
= = =
For those of you who have not had the chance to take a 30 day free trial for ChartLabPro.com, now is your opportunity to sign up and be grandfathered in for life before prices increase at the end of this month.

