

Japan has had a great run recently as it’s up roughly 13 from its April low. However, with that bounce it’s taken the iShares Japan ETF (EWJ) up to its previous high which has begun to act as resistance. Looking at the chart below we have the price action for EWJ going back to early 2013. Since then, EWJ has hit the $12.20 level three previous times.
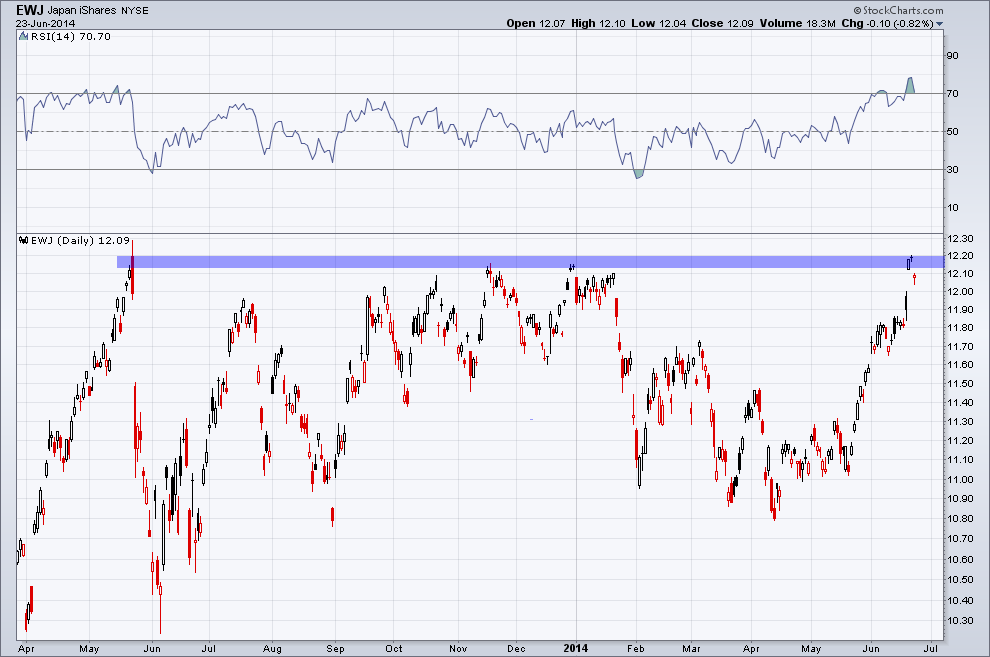
Last week we gapped back up to $12.20, which has pushed the Relative Strength Index (RSI) to well over the ‘overbought’ level of 70 which while bullish as it indicates a strong force by the bulls, it creates a bit of a headwind as EWJ gets a little over stretched. As trading opened up this week we saw the Japan ETF gap down, which created an island candle pattern, which is a historically bearish pattern. It’s possible we see EWJ fill the gap that took it to $12.20 and either continue higher or begin a trend change to the downside.
Disclaimer: The information contained in this article should not be construed as investment advice, research, or an offer to buy or sell securities. Everything written here is meant for educational and entertainment purposes only. I or my affiliates may hold positions in securities mentioned.

