

Many have tried, and most fail. Becoming a ‘day trader’ is not as easy as it appears…
Building a short-term strategy in any market presents a series of challenges that most traders, especially new ones, simply cannot overcome. Prices move quickly, and when using leverage, losses can mount even faster.
The future is just as unpredictable whether we’re looking at a daily or a 5-minute chart; so strong risk management is a necessity regardless of the time frame or desired holding period. Of the upmost importance for such situations is balance: Ensuring that the strategy and entry protocol mesh with the trade and risk management for the given condition(s).
Focusing on Conditions
One of the challenges of trading short-term is seeing the ‘forest from the trees.’ If we sit around and watch 5-minute charts all day, we’ll see plenty of new trends, or reversals; but what do those mean to the ‘bigger picture?’
It’s impossible to know without investigation. This is where Multiple Time Frame Analysis comes into play. By using a longer-term chart to seek out that ‘bigger picture,’ traders incorporate the ability to devise their entries along with the ‘bigger picture’ of that market.
So before any entry is ever investigated, the trader needs to find a trend that may be strong enough for continuation; and preferably this potential trend will be located on a longer-term chart. For short-term trading (often called or considered ‘scalping’), the hourly chart can work phenomenally well for this purpose.
Traders can look to the hourly chart to identify trends. In this strategy, an exponential moving average crossover (8 and 34 periods) is used to show trend-direction on the hourly chart. Keep in mind, this is simply a trend-filter, so no trades are enacted based on this filter: This simply delivers directional bias to the trader and the strategy.
If the 8 is above the 34, only long positions are investigated and if the 8 is below the 34, only short positions are operable. Most charting packages will allow for traders to plot indicators on different time frames, and this can be extremely convenient for this purpose. In the chart below, the hourly 8 and 34 periods EMA are plotted on the 5-minute chart; along with notations for the strategy.
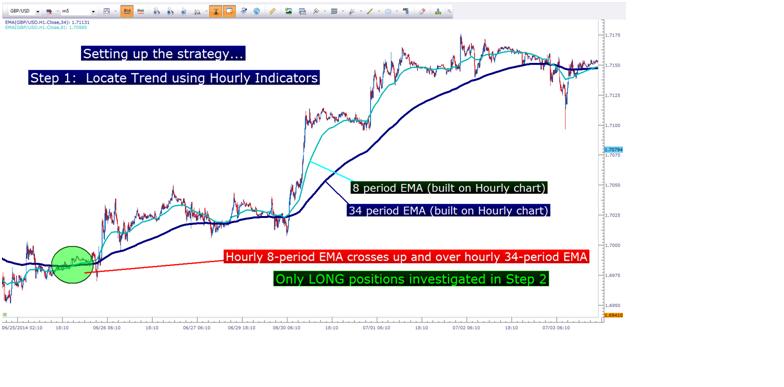
Created with Marketscope/Trading Station II; prepared by James Stanley
Finding the Entry
After a trader has located a bias in the market (the direction of the trend as seen on the hourly-chart), they can begin plotting the entry into the position, and this is where the shorter-term chart comes into play.
If a market is showing an up-trend, it will generally show a series of ‘higher-highs’ and ‘higher-lows,’ or a series of ‘lower-lows’ and ‘lower-highs,’ (in the case of down-trends).
We can use this to our advantage.
We already know which direction we want to approach that market; now we just need to wait for the right moment to enact the position.
If we’re looking to go long, we want to see prices moving higher after making a ‘higher-low.’ This higher-low is an extremely important point-of-emphasis, as this allows for setting the stop which is the center of the risk management of the strategy.
The goal here is to find a comfortable support level; so that the trader can enact the position, place the stop on the other side of support as confirmed by a ‘higher-low,’ and confidently hold in the position with the idea that ‘as long as this higher-low holds, I’ll remain in my long position.’
The trigger into the position is price-crossover of the 8-period EMA on the 5-minute chart. Price crossing the moving average in the trend-side direction means that a recent retracement was seen; and the trader is entering the position with the anticipation that the momentum seen on the hourly chart may continue moving in that direction.
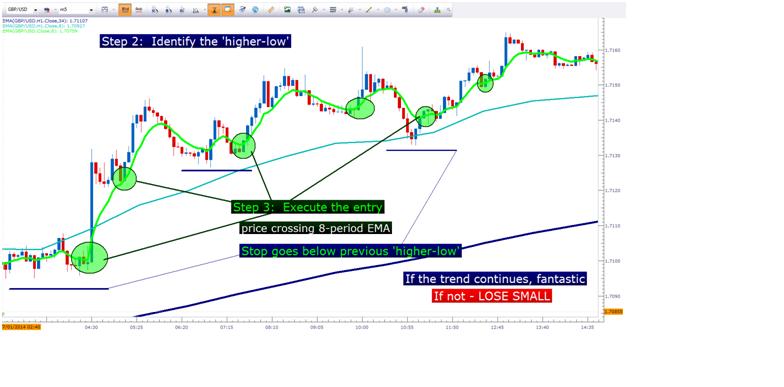
Created with Marketscope/Trading Station II; prepared by James Stanley
Stops, Targets, Exits and Position Management
Thus far, we’ve merely covered the entry and the stop placement into the position… and there is a reason for that: After the trade is placed, there are numerous ways to go about managing the position and risk from the strategy.
Traders should look to place stops at least 10-15 pips away as any closer risks getting ‘wicked’ out of a position before the trend may continue. To this end, traders should only enter when they feel they can reasonably obtain at least as much profit if they’re right than they stand to lose if they’re wrong (a minimum 1-to-1 risk-to-reward ratio).
One of the best parts about the strategy is the potential for unlimited up-side should that ‘bigger picture’ trend continue, and this is something the trader can attempt to capture by utilizing a ‘scale-out’ approach on the exit.
Traders can close a portion of the position at a 1-to-1 target, more at a 1-to-2 target, and even more at 1-to-3 and 1-to-4 targets; so that if there is any ‘up-side’ surprise in that market, the trader can look to garner as much of that to the profit-side of the ledger as possible.

