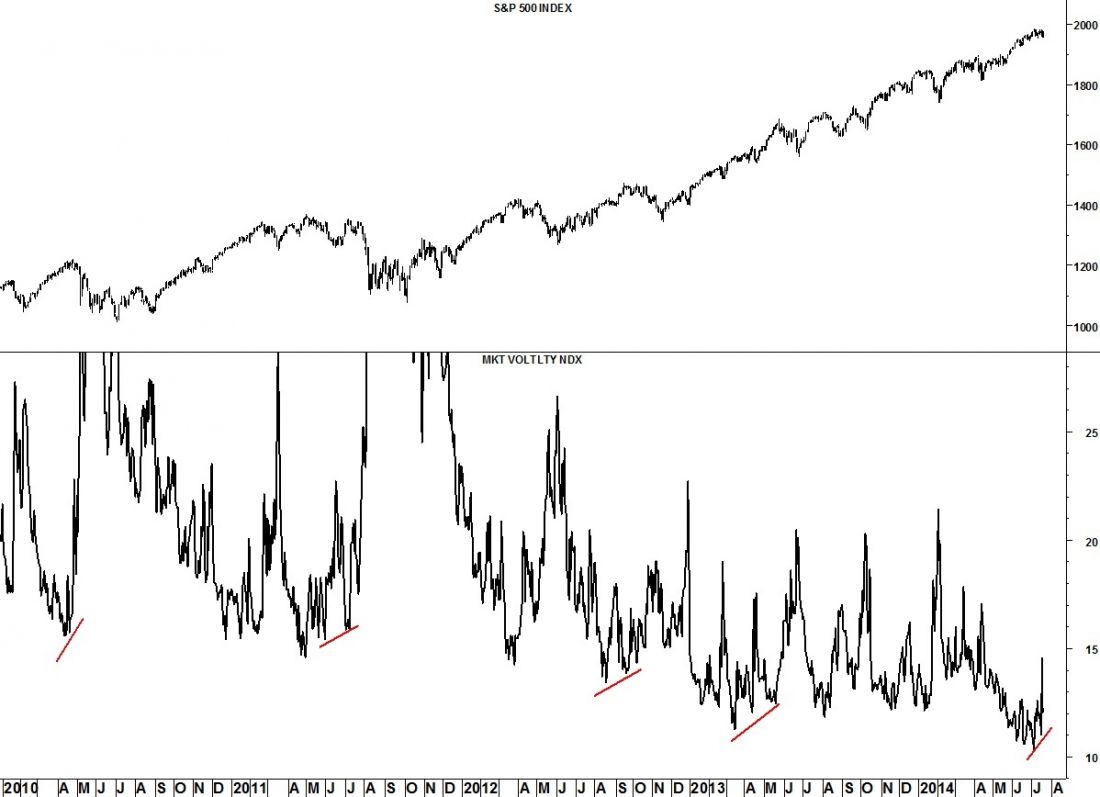
The CBOE Market Volatility index, or VIX, is a key measure of market expectations of near-term volatility conveyed by S&P 500 stock index option prices. The VIX moves inversely with equities so that when equities are rising, the VIX is falling and vice versa.
Important (and not so important) highs in equities usually arrive with a positive divergence in the VIX. A positive divergence occurs when the VIX leaves behind a higher low while equities print a higher high. We would normally expect the VIX to print lower lows (per the inverse relationship) as equities rally higher.
The VIX also appears to have a seasonal pattern. While not perfect, the VIX tends to rally during the period between the first of July and the end of October. These VIX observations seem to confirm the Lindsay forecast given in last week’s article.