

Trading on small time frames like a one to five minute chart can create a lot of noise and prevent you from riding out the bigger move.
By focusing on a higher time frame like the fifteen minute chart you can tune out allot of the noise and possibly ride out a bigger move.
As a gap trader I will use the fifteen minute chart after noon market time. This way it gives the stock some time to show me a trend and develop some price stability. An example of this is a trade I took this week when DG (Dollar General) gapped up on earnings.
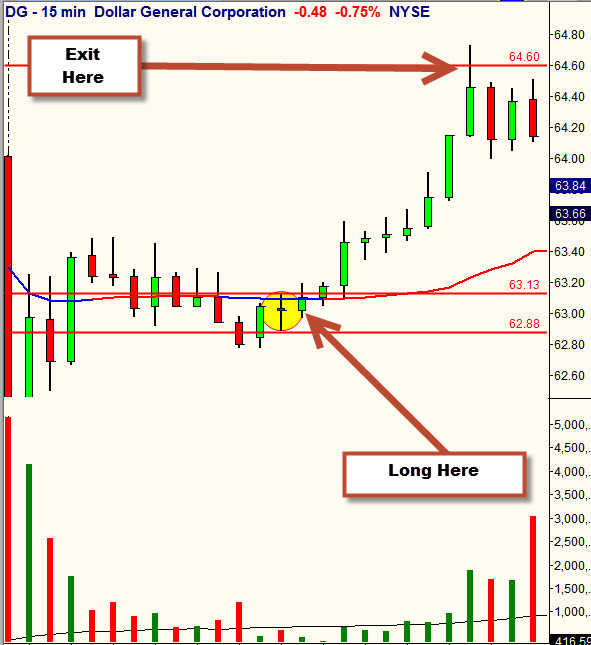
DG’s reaction to the gap up at the open was a bit of selling. It later bottomed out creating a very nice 15 minute setup. My favorite candlestick on the 15 minute chart is a narrow range bar after testing a floor of support below. The candlestick doji reminds me of a compression bar because once traded over they tend to ignite the stock higher into a nice trend.
The Trading Action
On August 18, 2014 at 1:00 pm DG formed a 15 minute compression bar giving a very tight entry. I bought long over the high at $63.13 and placed my stop at $62.88 just below the bar’s low. I always manage my trade by the timeframe in which I entered. Once a surge of buying came in near the end of the day I began to tightening up my trail and trailed out at $64.60. Entry was $63.13 minus the stop of $62.88 which gave me a risk of .25. With my exit at $64.60 minus my entry at $63.13, I was able to gain $1.17 which gave me 4.68 times my risk amount. A very nice high odds, low-risk entry.
Key Takeaway
If you find yourself being stopped out a lot and frustrated by losing — slow down, take less trades and go to a higher time frame. You will trade less and make more money and you will find yourself less stressed and a lot happier.

