
Oscillators come in a number of different forms such as stochastic, relative strength and the commodity channel index. Although the mathematical equations are different in each, the underlying principal by which oscillator calculations are made remains the same.
How They Work
All oscillators compare the high and low of a given market move to its close. This is the reason that oscillators are a bounded set of indicators. As the close of a market move approaches its high, the oscillator traces out a rising line. As the close approaches infinitely close to the move high, the oscillator line levels off at its peak and may remain there for a considerable period of time. Once the close approaches infinitely close to the move low, the oscillator line levels off at its nadir and may also remain there for a considerable period of time.
With the oscillator at its high, bulls are firmly in control and at its low, bears are firmly in control. The question at this point, is how to use this data to best determine the markets future direction.
There are two schools of thought on this matter.
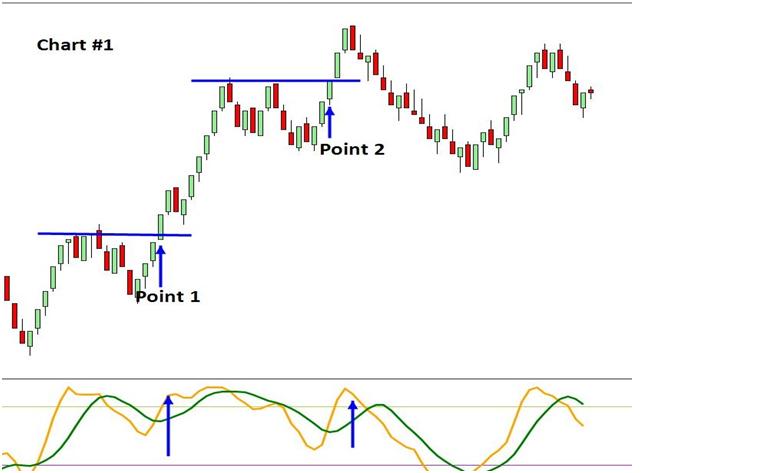
At Point 1 on the above chart the oscillator line (yellow line) is at its apex. Bulls are firmly in control. One group of traders would continue to buy in an over-bought market as long as the market continues to break pivots to the upside. The exact same scenario is present at point 2: the market is over-bought, bulls are firmly in control and these traders would continue to buy pivots as they break to the upside.
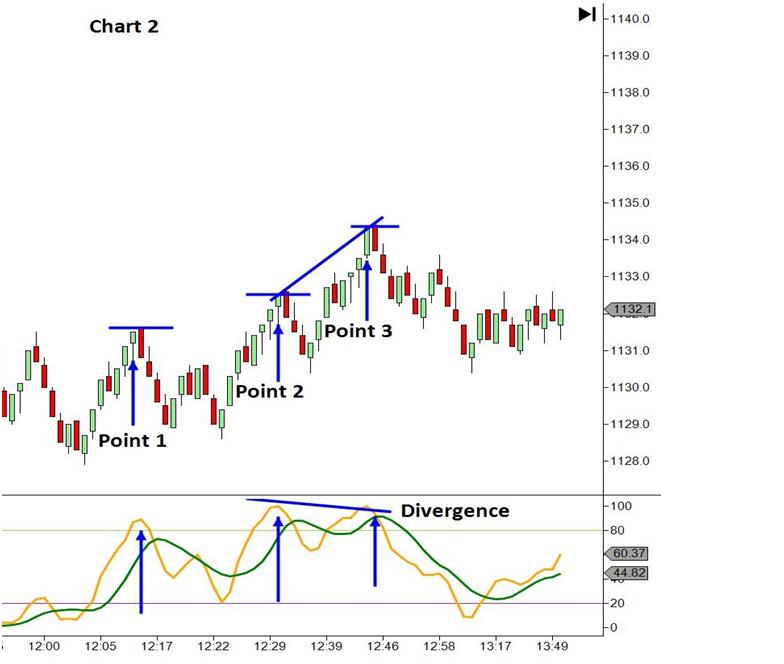
Another group of traders use the oscillator in a different manner. They would not buy into an overbought market. These traders would stand aside at points one and two. They would use the oscillator as the predictor of a market turn not as evidence of market continuation. At Point 3 price makes a higher high but stochastic makes a lower high. This is known as stochastic divergence. These traders would take this as a sign of an impending market fall and look to short the market at this level.
Ultimately, what is the most prudent way to use oscillator signals? Should you buy or sell an overbought or oversold market or should you look for oscillator divergence and use the signal as a sign of an impending market reversal? The answer to this question is not an easy one to answer but we have attempted to shed some light on this issue.
We looked at one year of market replay data and assessed the ability of the stochastic oscillator to predict the break of a trend line. One would assume on an empirical basis that a trend line break to the upside would be more likely to occur if the stochastic line was moving to the upside. Conversely, one would assume that a trend line break to the downside would be more likely to occur if the stochastic line was moving downward.
Surprising Conclusion
Our results were surprising. In 233 potential trend line breaks, no statistical correlation was found between successful trend line breaks and stochastic direction using x2 test (chi-square) analysis. Thus, stochastic indicator analysis had no predictive value as to success or failure of the trade (break of the trend line). Based on these results we have discarded the oscillator for use in our trading methodology. We believe that order-flow, momentum and market structure comprise all the predictive components necessary to optimize the success of a trading entry.
= = =
Learn more about Right Line Trading.
Related Reading
Read another story by Mark Sachs

