

If you are only using traditional price charts and indicators, you are missing the most valuable information that the market provides. The information I am talking about is volume-at-price.
Volume-at-price analysis provides valuable information about what prices have seen the heaviest institutional interest and can give insight into where the smart money is accumulating and distributing. While traditional indicators are often simply derivations of price information, volume-at-price provides unique additional information that is not available to traders only using traditional technical analysis methods.
By applying volume profiles to specific areas of the chart, information can be drawn out of the price action identifying areas of support and resistance as well as trend information.
You can see on the hourly chart of the E-mini Nasdaq futures (NQ) that the recent move higher has been accumulating areas of volume on the way up. These are future levels of support on any pullback and potential areas of trading opportunity.
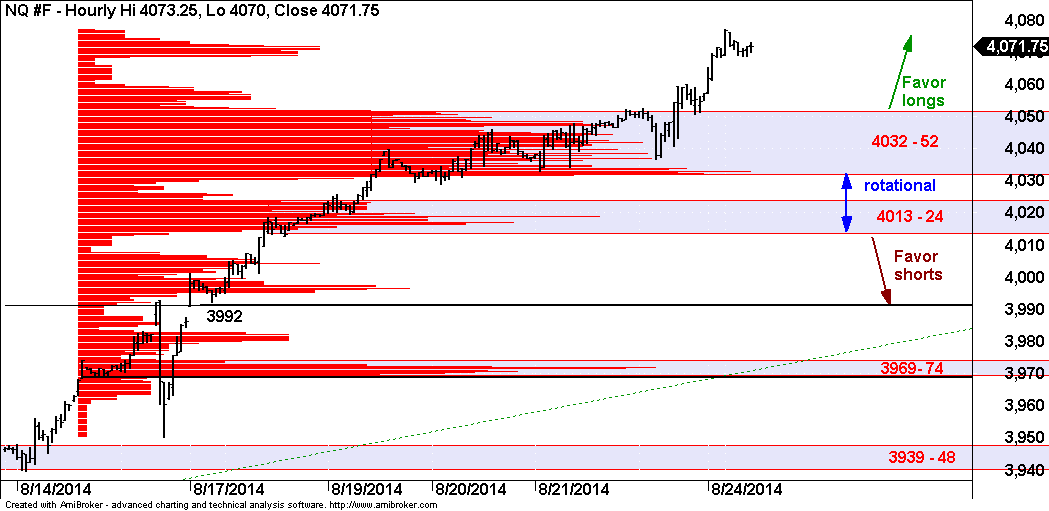
We refer to the areas of heaviest volume within the volume profile histogram as high-volume areas, or HVA’s. The location of HVA’s and the price action around them are determinants in forming trade setups as well as expectations and probabilities of subsequent price action.
Volume-at-price analysis is applicable and useful at all degrees of scale, from weekly charts to 5-minute charts and everything in between. Performing this type of analysis in multiple timeframes will allow you to integrate the broad view of what the market is doing with the immediate movements at a more granular level. It can also enable you to enter positions that, in addition to having favorable odds of success, also have very favorable risk/reward metrics.
= = =
To see more research and analysis from i10 Research and receive a 30-day free trial of our daily and weekly trading reports, visit our page here.

