

With the passage of the final high of the 2009 bull market high in the Dow (precisely forecast by the Lindsay model in July) our attention now turns to the S&P 500.
Unfortunately, Lindsay’s methods only apply to the Dow so we must use other means but, as history has shown, highs in the two indexes shouldn’t be too far apart (in the year 2000 the Dow’s high was in January and the S&P’s was in March).
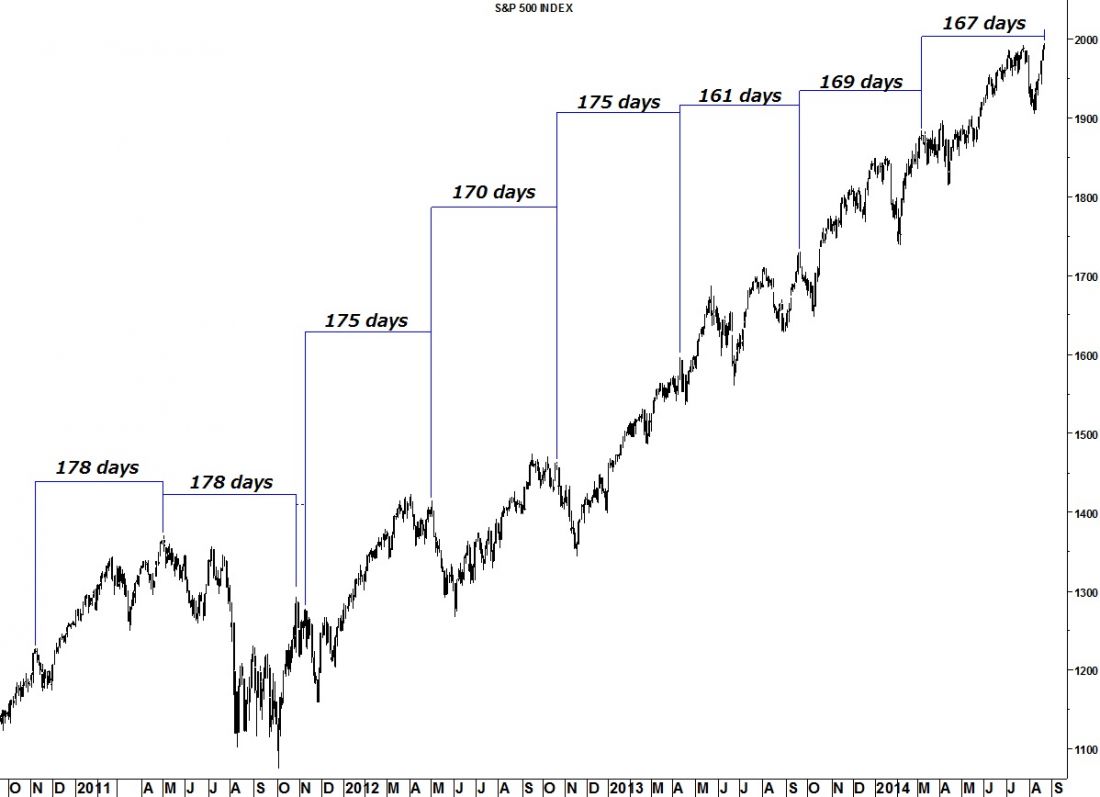
The chart below shows a six-month cycle between highs in the S&P 500 index. Actually, it is just under a full six months as the high always seems to appear in the sixth month.
Last Thursday’s new high in the S&P was 167 days after the high on March 7, 2014. This particular cycle could extend to as long as 178 days (September 1) but that would be out of character with the shortening of the cycle seen over the past year. Whether the final high for the S&P was last week or this week, it is very close.
= = =
Get your copy of the August Lindsay Report at SeattleTA.

