

Back in mid July I wrote that the S&P 500 (SPX) was close to major resistance at the Yearly R1 pivot point at 1990. On July 24 the S&P (SPX) tested 1990 and two weeks later had fallen 90 points (5%) to 1900.
How did I know that 1990 would be strong resistance?
I knew that the big banks, market makers and Algos all use pivot points. Most professional traders use daily and weekly pivots for short term trades. I have found the yearly pivot points (based on a calendar year) are where the big pullbacks or rallies start at. Pivots work with precision accuracy because they are a math calc that is easily programmed into computers.
Key Levels
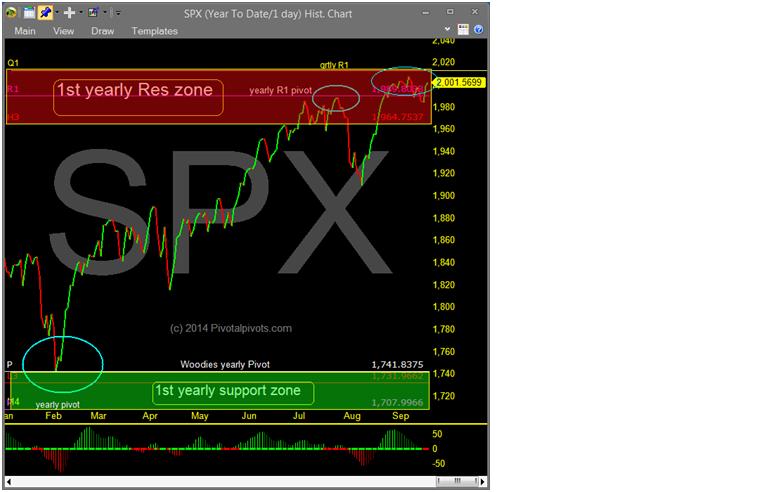
The low this year on the S&P (SPX) in February was on the yearly pivot point (P). Then the S&P (SPX) rallied up to the yearly R1 pivot (July 24) then dropped almost 5% a few weeks later (see Figure 1 below). TSLA this past week saw a big sell off after it tested the yearly R2 pivot at $288. PCLN is down $200 since hitting the yearly R1 pivot earlier in the year. FSLR, CSIQ, SCTY all have been testing the yearly R1 pivots for the past few months. UNG natural gas ETF is currently bouncing off the yearly pivot after failing at the yearly R2 pivot last winter. There are 1,000 of examples like this.
Take Your Trading To The Next Level
Since price moves from pivot point to pivot point, shouldn’t you be watching them? Most charting programs have them for free (tradingview.com, freestockcharts.com, stockcharts.com). Pivots will take your trading up to the next level.
= = =
To learn more about market timing services from York’s company (Prescient Financial Market Reseach) please visit PivotalPivots.com

