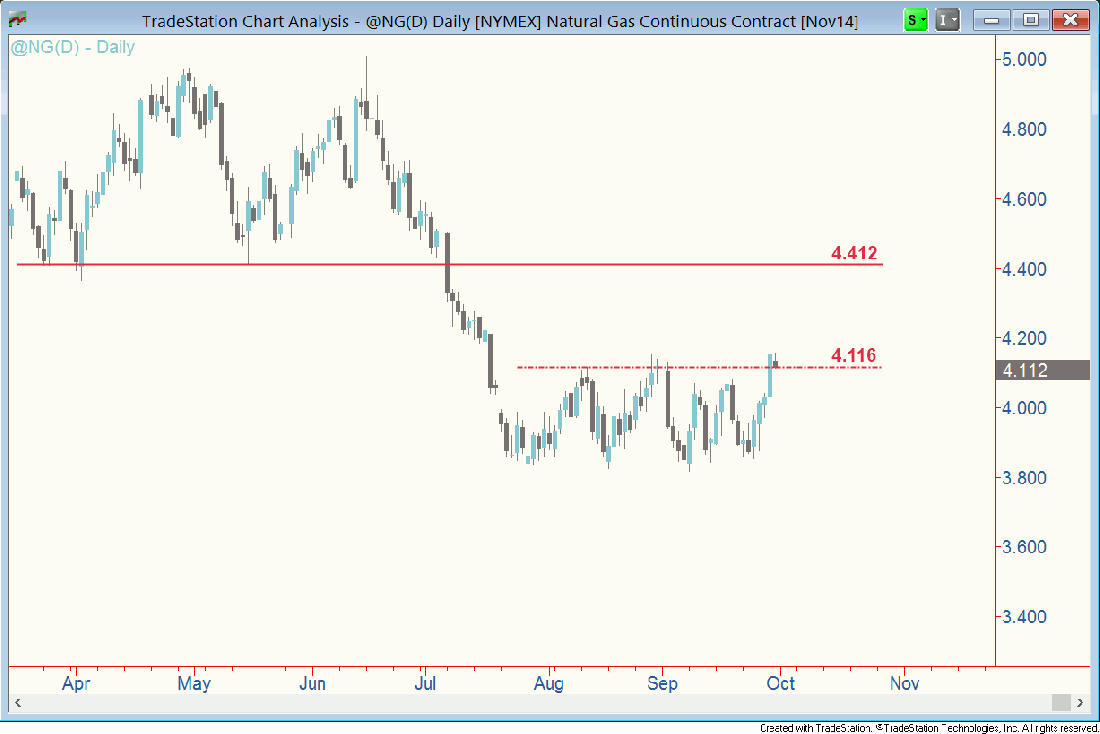
If you can stomach the risk of an inherently risky market, natural gas futures are in the process of breaking out from a platform base.
What’s more, a lack of any technical resistance overhead heightens the probability of follow-through buying in the coming weeks.
Chart Picture
I didn’t add any indicators to this chart because the price action alone tells the story. From July through September a floor emerged at 3.82; four attempts by the bears to break it failed. Two tests confirmed a ceiling at 4.116.

Monday’s rally was characterized by a tall bullish belt hold candlestick (open near the low, meaningful rally, close near the high). That’s a sign of high-conviction buying which adds to evidence that 4.116 probably isn’t a barrier anymore. Note the air pocket above the price point: very little trading took place in the area from 4.116 to 4.412 in recent years, so there isn’t any supply overhang to worry about.
Watch Closely
Keep in mind, momentum (as measured by moving averages of the relative strength index) are overbought on the 60-minute chart. That tells us the market has reached or is getting closer to a point of buyer exhaustion temporarily as swing traders take profits. Overnight weakness suggests this process may be under way, so you should be watching this market closely in the coming days.
Keep your position size small and set a loose stop loss; you need some added flexibility since this market is highly volatile, be it futures or UNG (United States Natural Gas Fund).
Good trading, everyone.


