

If you want to figure out the next move the markets will make, I have a secret to tell you about. Option traders have a trick that most investors and traders have never heard of, let alone understand. It is a little thing called skew, which is a real time view of where money is being bet. (In technical terms, skew is “the risk associated with an increase in the probability of outlier returns, two or more standard deviations below the mean.”)
Winning bets on skew requires outlier moves, which have a less than 5% probability (like a black swan event — I mentioned recently that the Ebola outbreak could be one). There is no better way to decipher which way the market is leaning when faced with a big event than looking at skew. On September 19, the index hit just over 146 – the same day the S&P 500 hit its highest level ever. Look at the chart below, and you’ll notice that each circle indicates market pricing was in a drop before it actually happened.
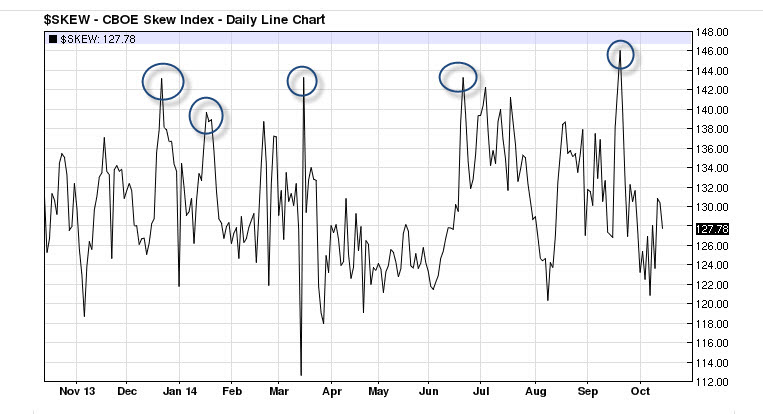
“After three years of non-stop gains in the U.S. stock market, investors are loading up on insurance at the first sign of trouble. … Concern that the losses will worsen has increased demand for shorter-dated, out-of-the-money options designed to protect a portfolio’s value. The Chicago Board Options Exchange’s SKEW Index, which tracks expectations for an outsized drop in U.S. stocks known as tail risk, reached 146.08 Sept. 19, the highest level since October 1998. … The gauge has averaged 129.77 over the past 12 months, compared with a mean of 122.82 during the past five years …” –
Callie Bost, Bloomberg.com.
This article on CBOE references more information, charts and data. Want to dig deeper into this topic? Check out the CBOE Skew Index FAQ.
= = =
Learn more about Lang’s work at Explosive Options here.

