

The S&P 500 made a near 10% pullback from the September high to the October low. The index is now rallying back and has regained three-quarters of the decline.
The important zone to watch on the S&P is the large zone of resistance as defined by the high-volume area on the chart below. This area is between 1967 – 78 and 1986 – 2005.
The price action around these resistance zones will determine if we will see a return to the long-standing, large degree uptrend or if we will see a resumption of the selling pressure that showed up in late September and early October.
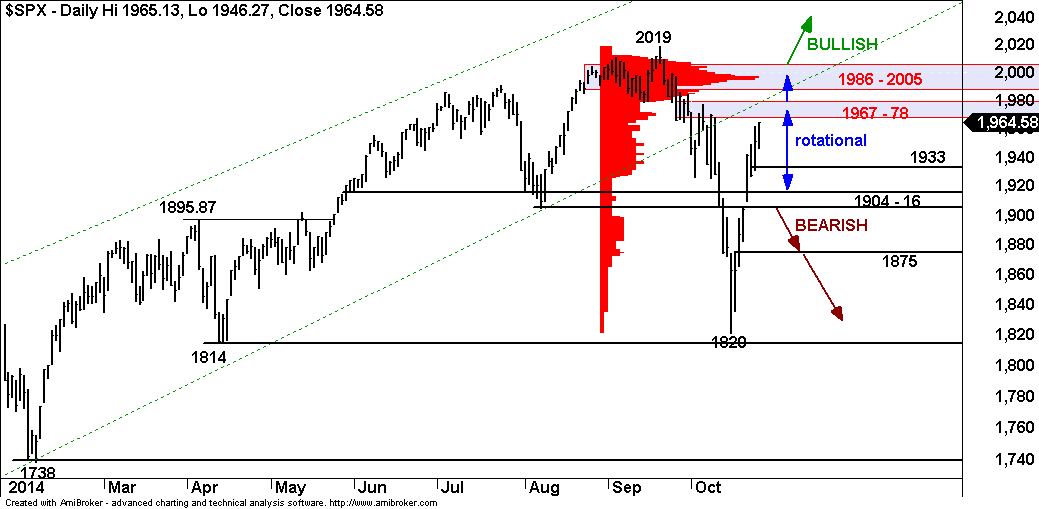
A move over these resistance zones would signal an ‘all-clear’ for the market on the upside. Conversely, a rejection of this area would be a signal that sellers are still in control and that they are using the bounce as another selling opportunity. Key areas of support below on any decline are 1933 and 1904 – 16.
= = =
See more research and analysis from i10 Research and receive a 30-day free trial of our daily and weekly trading reports.

