

The magnitude of the recovery in stocks from the sell-off in late September and early October is enough to silence the doomsayers for the time being. If things were really getting bad, there would have been enough institutional selling to prevent this kind of a bounce.
That’s not to say things can’t change. The drop confirmed a jump in volatility, which generally isn’t a good sign. Suffice it to say, it’s a risky time to be putting new money to work unless it’s for a relatively quick swing trade. I wouldn’t be surprised to see mostly choppy trading in the coming weeks.
With that in mind, it’s a good time to turn on your radar for evidence warranting a contrarian trade in S&P 500 futures. The E-mini is bumping up against chart resistance at 1970, a price point around which the market has turned multiple times since early July. This is very close to Fibonacci resistance at 1967 – a 76.4% retracement of the decline in late September and early October.
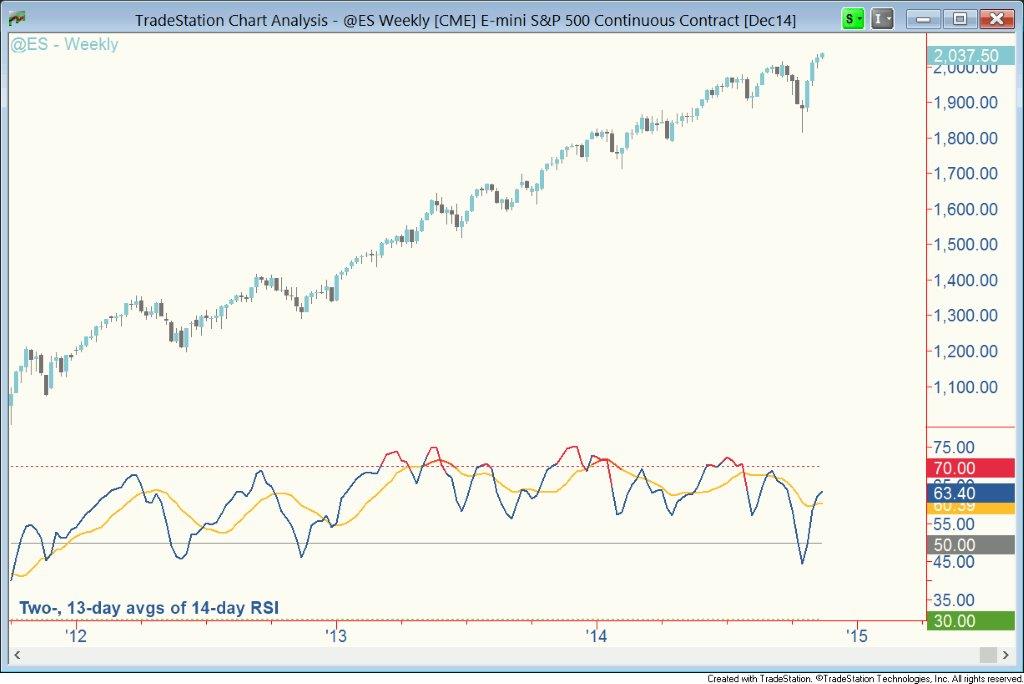
A final point is a little esoteric, but worth mentioning. The spread between the fast and long averages of the 14-day relative strength index is pretty wide, after the fast average jumped nearly straight up. This jump points to an abrupt surge in momentum that won’t be sustainable for long.
ES isn’t overbought on the 60-minute chart (not shown) and the price action doesn’t show any signs of buyer exhaustion, so it’s probably early to pull the trigger. Watch the price action with the perspective that the market is at an area where turns have occurred in the recent past. And if you do go short, don’t be greedy; there’s no shame in taking a modest profit on a two- or three-day trade in a choppy environment.
Good trading, everyone.

