

The most challenging aspect of the automated-order marketplace is to find an indicator that can reveal where the Dark Pools are accumulating a stock over time, and which stocks they are quietly rotating out of to lower their held shares of a required chartered stock.
Rotation and accumulation are hidden these days on Dark Pool venues that do not show the huge lot orders moving through the automated system. Before the year 2005, giant lot orders were either handled by market makers on the exchanges or the backroom block order processing system. In today’s market no giant lot orders move through the exchanges, so technical traders and High Frequency Traders (HFTs) have no way of seeing this activity until long after the transaction has taken place that day.
Dark Pools Lead the Market
It is the buying or selling incrementally over an extended period of time of Dark Pools that creates the bottoms, tops, and platform-market conditions (multi-sided markets where an intermediary captures the value of the interaction between user groups). These giant and large lot transactions use customized orders that are available solely to those institutions allowed onto the Dark Pool venues. These customized orders are completely different than what retail and technical traders use, and are totally different than the commonly used Volume Weighted Average Price VWAP orders popular with smaller funds managers.
In order to track and enter as a giant fund is slowly accumulating over time, retail and technical traders must use indicators that are not based on price and time, but rather are based on whether the large lot is ticking up or ticking down. Analysis reveals whether the giant lot orders that trigger slowly over a course of several weeks are accumulating stock, rotating to lower held shares of stock, or distributing to sell all the held shares of stock for that company.
Giant Buy Side Institutions are fundamentalists using Quantitative Portfolio Management Analysis. Therefore their patterns often contradict the older style trend patterns commonly taught in older, technical-analysis books. In other words, the Dark Pools of today have a huge advantage, which is their large lot orders do not move price, nor do their large lot orders alter the current trend of the stock.
Price and Time Indicators Do Not Work
With this knowledge, technical traders should quickly realize that all price and time indicators are therefore useless for identifying Dark Pool incremental buying or selling patterns. Since these dominant investors now can completely control the price they pay using the National Best Bid and Offer NBBO system to their advantage, it is impossible to determine whether they are buying or selling unless an uptick/downtick lot identifying indicator is employed in the chart analysis.
Balance of Power (BOP) is the most popular uptick/downtick based indicator used today. It was originally written and developed for a Sell Side Giant Institution that wanted to track competitors and Buy Side Institution large lot transactions.
As the market has shifted away from an open cry floor trading single and dual exchange venue system to a complex multi-tiered automated venue system, BOP has become even more effective and useful in tracking the Dark Pool activity.
It is a histogram and is easy to learn with obvious patterns that speed up the analysis process. It is also highly useful when added to scans to screen down the some 6500 stocks to a list that shows the heaviest concentrations of Dark Pool activity.
Since HFTs spend an inordinate amount of time and money attempting to find and chase Dark Pool incremental buying or selling patterns, using BOP allows the technical trader to enter a stock prior to velocity runs out of a bottom, speculative runs after a Dark Pool quiet accumulation phase, and before HFTs sell a stock short at the top of a run.
How To Use BOP
BOP can be used for intraday, day, swing, momentum, velocity, and position trading. It is a short term indicator that works best on a short term or intermediate term analysis format.
“Shift of Sentiment™” is one of the best BOP patterns and is also the easiest to learn. As a market corrects, smaller funds using VWAP orders will trigger after HFTs have sold a stock down from a speculative high. As the stock trends down, Dark Pools will begin to enter with their specialized orders that will not disturb the trend until the smaller funds run out of selling energy.
Below is a chart example showing Group 1 Automotive Inc. (GPI) with the indicator BOP in the bottom chart window.
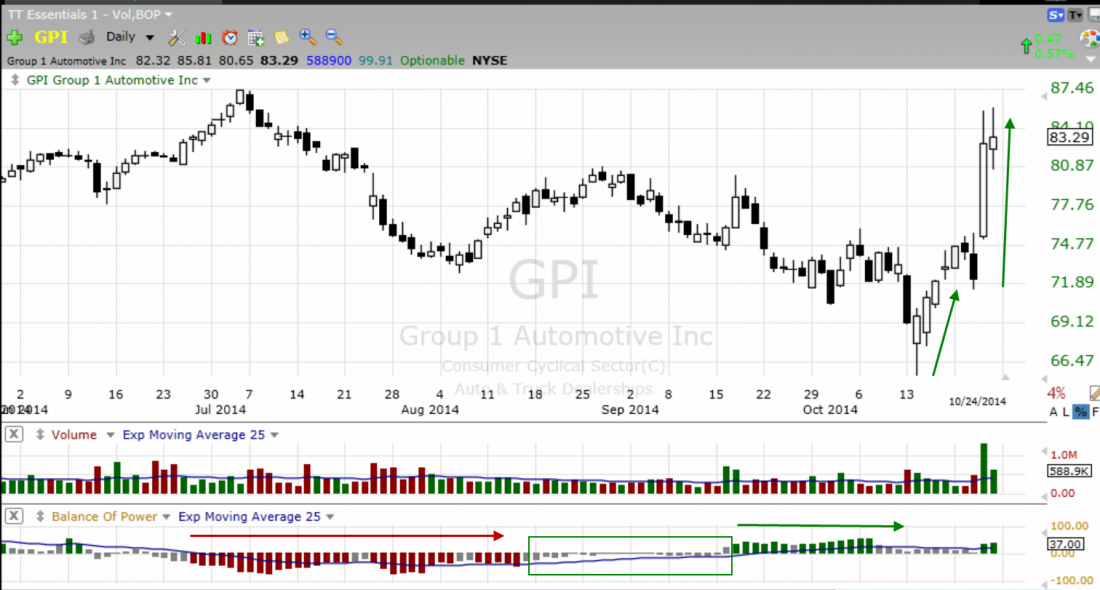
BOP turning red is the selling-pattern footprint of smaller funds. In this chart example, BOP turns gray, exposing that footprint even while there is still some smaller funds and smaller lots capitulating and selling. The BOP indicator has shifted and is now controlled by the Giant Funds using Dark Pools. At this point, none of the other market participant groups such as HFTs, smaller funds, or retail traders are aware that the large lots are firing on the buy side. Only the indicator BOP shows what is actually occurring. As the smaller lots stop selling, the Dark Pools large-lot dominance takes control and halts price. BOP allows you to see these transitions well ahead of the final low, and the sudden velocity move occurs by HFTs, which is so common in bottoms these days.
Well before the final low, BOP turns green as the Dark Pools take control of price completely. They use a bracketed order that triggers within a preset price range, usually about a 5-10% range of the price. Their automated orders trigger incrementally over several days, so long as the price remains in their preset range. When price moves out of their preset range, their automated orders cease. At that point, professional traders who are also tracking Dark Pools via uptick/downtick indicators are buying. Then, finally, HFTs spike volume and drive price up with a velocity run. Retail traders and smaller funds chase the next day, but by then HFTs are selling down.
The Shift of Sentiment BOP pattern can occur over several months or just a few days, depending upon the stock chart and how quickly price falls during a short or intermediate term correction. The example of the stock chart GPI was of an intermediate term correction, with a Shift of Sentiment BOP pattern during that period of time.
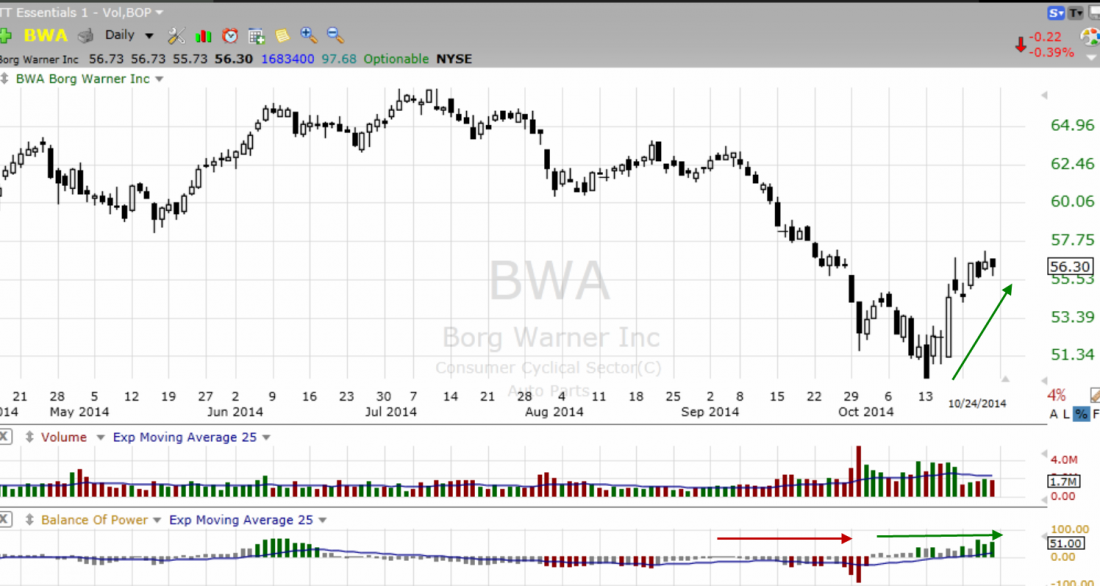
During a short term correction the BOP Shift of Sentiment develops within the time period of a few days, for excellent swing and momentum entries ahead of the HFT huge volume spike and long single day runs.
The chart example of Borg Warner Inc. (NYSE:BWA) below shows a short term correction Shift of Sentiment on BOP in the bottom chart window.
Summary
With the most prominent Buy Side Institutions now using precisely controlled entry and exit orders that do not disturb price or trend and trigger on Dark Pool venues, technical traders need better indicators that can reveal where the giant and large lot transactions are occurring. Often price will move in a Consolidation or Platform pattern, which makes it difficult for price and time indicators such as MACD to function properly. Frequently, Dark Pools will be so well hidden that their entire accumulation or rotation mode goes unnoticed by technical traders who are using price and time indicators, and consequently the sudden explosive move of HFTs takes them by surprise.
This can be hazardous to traders who find themselves on the wrong side of the trade. They lose money suddenly because of using price indicators, when the trend shifts without any apparent warning.
Employing an uptick/downtick indicator such as Balance Of Power BOP, which is designed to expose whether large lots are triggering on the buy side or sell side, is the only way technical traders can be prepared ahead of time for the sudden bottoms, tops, and velocity runs that occur after Dark Pools have bought or sold.
Trade wisely …
#####
Thank You For Reading My Article
Related Reading
Use The Predictive Sentiment Cycles
TechniTrader technical analysis using TC2000 charts, courtesy of Worden Bros.
Disclaimer: All statements, whether expressed verbally or in writing are the opinions of TechniTrader its instructors and or employees, and are not to be construed as anything more than an opinion. Readers are responsible for making their own choices and decisions regarding all purchases or sales of stocks or issues. TechniTrader is not a broker or an investment advisor; it is strictly an educational service.

