

The recent action in the markets has created a distinct advantage for the stock picker. How do I know this? Take a look at the chart below of the implied correlation index, or the ICJ.
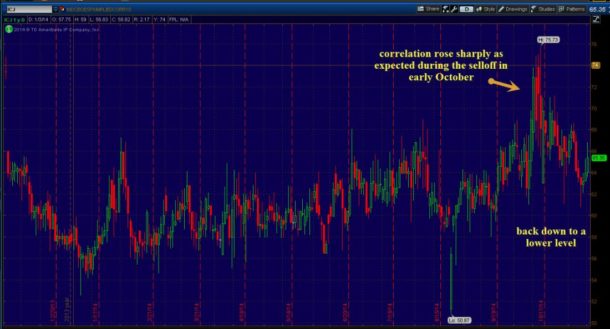
Simply put, this is a market-based estimate of the average correlation of stocks that comprise the SPX 500. When the level is high (above 73%), we see a strong correlation between the market and individual stocks.
High correlation means that when macro news hits the market, most stocks will respond in kind, regardless of news. Yet, when the ICJ is lower, we consider that a condition where news won’t necessarily effect individual names. In fact, stocks tend to move on their own merit, and as a chartist, that is what I’m looking for. If my edge is in reading the technical and chart condition, then I prefer no other influence. In a perfect world, that gives me a great chance to succeed.
Since the implied-correlation index measures the changes in the relative premium between index options and single-stock options, we can apply different methods at certain times. There are strategies to use when it comes to analyzing correlations.
In theory, when implied correlation is high, index-option premiums are rich relative to single-stock options. Hence, selling premium in the indices (straddles normally) are the optimal strategy, in addition to buying relatively inexpensive equity options.
Currently, market correlation is low and has been since the correlation “bubble” burst in January 2012. We have seen spurts in the index on occasion over the last couple of years, but the trend is still in alignment.
#####
To learn more about options trading, click here.

