

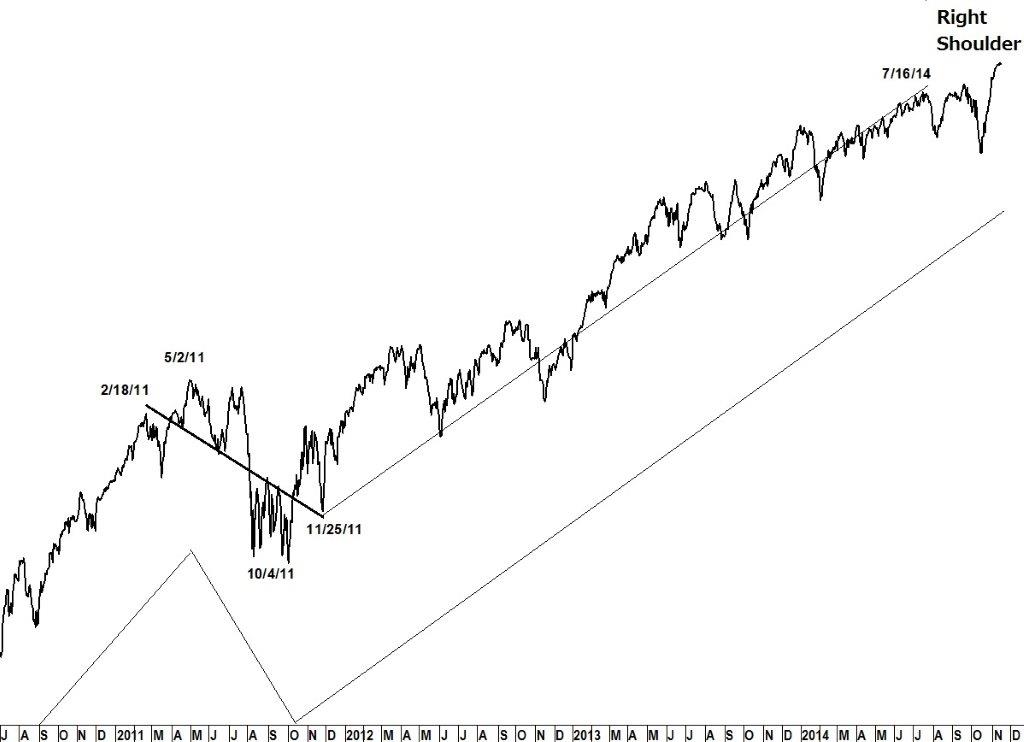
With the October rally exceeding the September high, we find ourselves once again searching for the right shoulder high that will mark the end of the bull market.
The rally from the end of the Sideways Movement on 11/25/11 terminated at the July high earlier this year when, after 964 calendar days, the Dow dropped 770 points, marking the end of the longest of Lindsay’s standard time spans.
We know from the preserved, written work of George Lindsay that a right shoulder always follows a long basic advance. While a right shoulder is usually lower than the high of the basic advance, Lindsay left open the possibility that a higher right shoulder is possible and history shows that this possibility is not without precedent.
Multiple middle section forecasts for the high of the right shoulder are pointing to this Friday, 11/21/14. But the seasonal tendency for stocks to rally during the week of the US Thanksgiving holiday (Nov 24-28) presents the possibility that the high might be printed a week later than forecast (albeit within the margin of error for such forecasts).
While cycles (non-Lindsay) point to a high of unknown degree late this week (a market pullback during the first half of December fits the seasonal pattern for equities), a forecast for a market top in November is really fighting end-of-year bullish seasonality.
Assuming a cycle high arrives on schedule this Friday, and barring an absolute collapse in equities, we won’t know for certain whether this is truly the end of the bull market until we see if the next cycle top, due in late January, manages to print a higher high.
The high should fall within Lindsay’s long-term interval of 15 years to 15 years, 11months. The longest this interval has ever stretched is 16 years and one month, and a November high would make the interval from the Oct 1998 low, 16 years and one month.
#####
To get your copy of the November Lindsay Report, click here.

