

Seasonality wise, the bulls have the edge heading into years end, but history is suggesting a pullback to start this week. The week before Thanksgiving is typically a down week. Bullish sentiment has hit 96%, which is a contrarian indicator, so expecting a pullback this week makes sense.
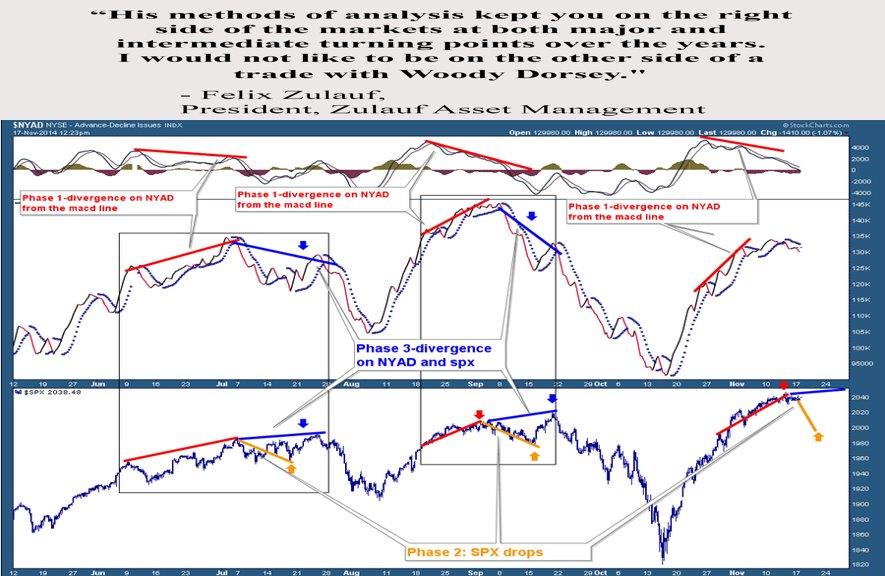
There are other factors aside from history that are hinting of a pullback as well. The $NYAD (NYSE’s Advancing/Declining Issues ratio) is in a phase-1 pattern, with phase-2 down pending. Phase one of the $NYAD pattern is when the MACD starts diverging from the actual $NYAD price.
Phase two of the $NYAD pattern has both the $NYAD, as well as the SPX (SP500 index), dropping together. That has typically produced a 25-40 point drop in the SPX. But the move off the October 15th lows has not been typical at all, as we have watched the SPX tag some 220+ points in less than one month without any pullback whatsoever.
That leaves the door open for the phase-2 $NYAD pattern to be a little deeper to the downside, maybe 40-60 points on the SPX. But so far, we haven’t even seen any type of pullback. Maybe this time is different? It might be, but risk is definitely at high levels, if this pattern and history is a guide.
“It is of note that stocks have gone nowhere for six days while generic optimism has continued. As I said last week, there is a local negative energy due early this week, which has been threatening but has not yet become overt.” —Woody Dorsey
Still, the wide-ranging bar from last Thursday offers tight risk parameters. If taken out on the downside, selling opens up.
Seasonality favors the bulls and history favors the bears, so which way will the market go? The $NYAD pattern and extreme bullish sentiment suggest a direction.
For more detailed reports, click here.

