

The value of the Aussie dollar to the greenback is breaching a key chart support level this week. Concurrently, momentum is showing a bearish signal. Together, these conditions place odds on deeper losses to come.
As the chart below shows, the Aussie has struggled with support at 0.866 – derived from the January low – since October. Price is falling below that threshold this week after three weeks of a tepid attempt by the bulls to take the market higher.
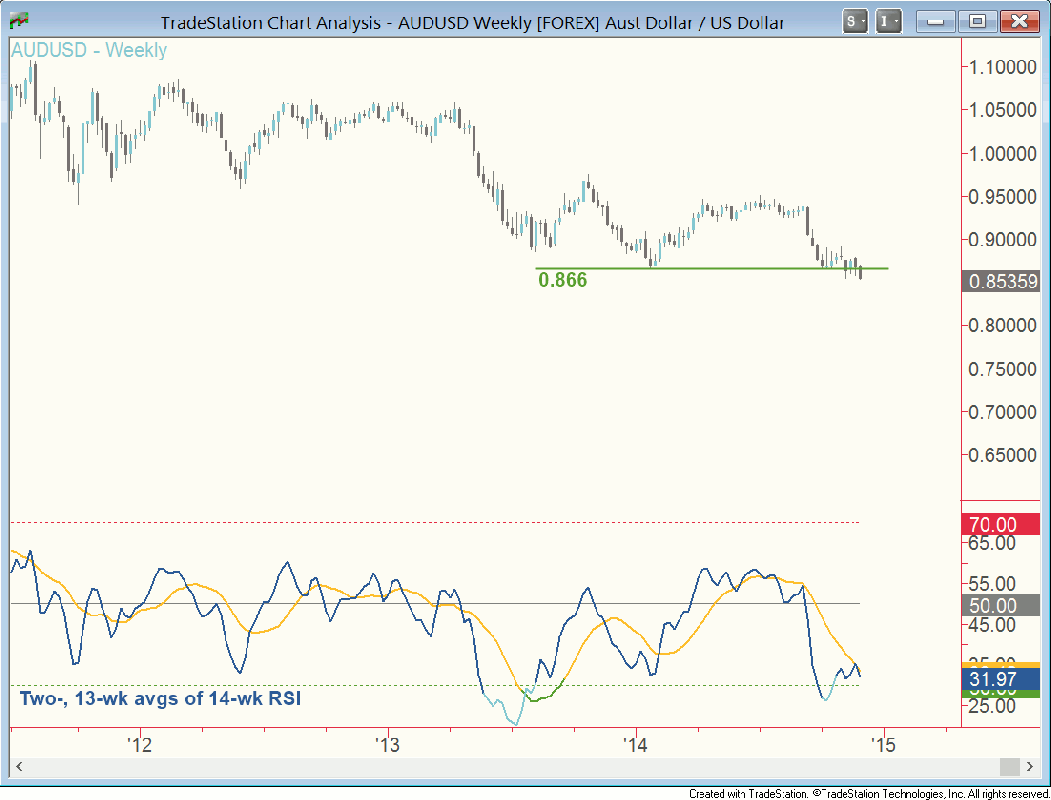
Meanwhile, unless the market recovers substantially by the end of the week, weekly RSI averages will show a sell signal. The slow average (orange) has been falling steadily since August, showing long-term momentum has been deteriorating. The fast average (blue) recovered from an oversold reading in October and tested the slow average last week. This week, the fast average is poised to turn back down. That would complete a sell signal. The implication is that, within the context of a downtrend, selling resumed after a pause.
The coincidence of the sell signal with the violation of support would heighten the odds of this downtrend deepening. The next area of chart support is down around 0.807, leaving significant downside potential from the current level.
Good trading, everyone.

