

Crude oil has had a significant decline since June 2014. Looking back through the lens of multiple timeframes we can see how price and volume gave clear indications a large decline was about to occur. In particular, we can see at work some of the principles first described by Richard Wyckoff nearly a century ago and how these principles can be applied for excellent trade entry and exit locations as the modern market is unfolding.
A Reasonable Question
You may be thinking, “How could someone who read the market through a paper ticker tape possibly be relevant in trading today’s 24-hour global markets with algos, high frequency trading, and instant news coverage?
The answer is highly relevant. In his day, Wyckoff was in a position to see how large, professional operators acted behind the scenes. He also saw how the average trader behaved. He was the first to put the actions of these two groups together and identify how their behaviors can be seen within the price bars and volume on a chart.
Human behavior is subject to the principles of evolution; it changes gradually over thousands of years. Although technology has forced many astounding changes in the trading world, trader behavior remains unchanged. What Wyckoff wrote nearly a century ago is highly relevant for the modern trader.
Charts Tell the Story
Figure 1 below shows the monthly continuation chart of Crude-Oil futures. At “A” in August 2013, Crude Oil tried to rally above the early 2012 high but failed to go higher. This is known as a “Wyckoff Upthrust”— the inability to follow through after making a new high above previous resistance, then falling and closing underneath that resistance.
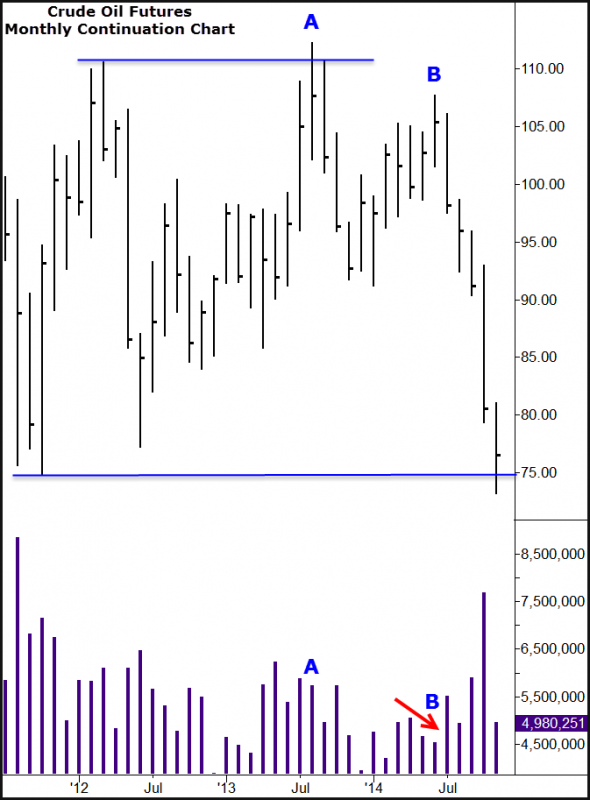
At times, an Upthrust will be followed by a swift down move. At other times, the market will move lower and then rally to test the Upthrust making sure demand is no longer present. Crude tests for demand at “B.”
We see that volume at B was much lower than the volume at A, indicating reduced willingness of buyers to push prices up at B. Volume also receded as the market rallied to B (red arrow). Volume is the fuel of the market. To keep going uphill, the accelerator must be applied. This was not happening on this rally.
Figure 2 below shows the weekly continuation chart of Crude-Oil futures. The rally to test the monthly UpThrust at B and the subsequent decline are shown.
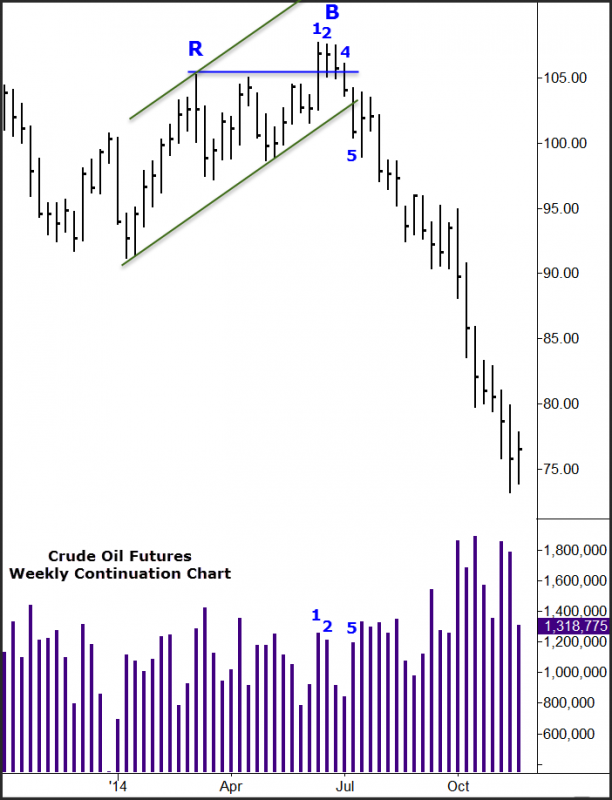
There are several principles to note in this chart. First, the last leg up was unable to advance to the upper trend channel line. In Wyckoff terms, the thrust shortened. The market will experience shortening of the thrust for one of two reasons: either buying has waned or selling has come into the market. Here, selling has entered.
We know this by reading the individual price bars and their associated volumes. At bar 1, we see expanding range (the difference between the high and low of the price bar) on good volume. This, by itself, is bullish behavior.
Bar 2, however, tells a different story. The volume on Bar 2 is essentially the same as on Bar 1 but the range has narrowed considerably. Only one thing does this in this type of situation and that is selling. While buyers may have been actively buying during this bar, every time a buyer was buying, someone was selling. This is why the range narrowed. Selling was so strong buyers could not lift the market. It showed sellers were gaining control.
On Bar 4, the market closes underneath the last resistance (marked R). This is a weekly Upthrust. It has the same implications seen earlier on the monthly chart. By the close on Bar 5, we see not only that the uptrend channel has been broken, but that volume has increased to the downside. This is very bearish. Supply, or selling, is now in control of the market.
The daily chart is shown in Figure 3 below. Numerous opportunities to go short were available to the price and volume trader following Wyckoff principles. The astute trader would see that at Bar I, volume was increasing at weekly support and breaking that support, causing a weekly Upthrust and an excellent location to go short.
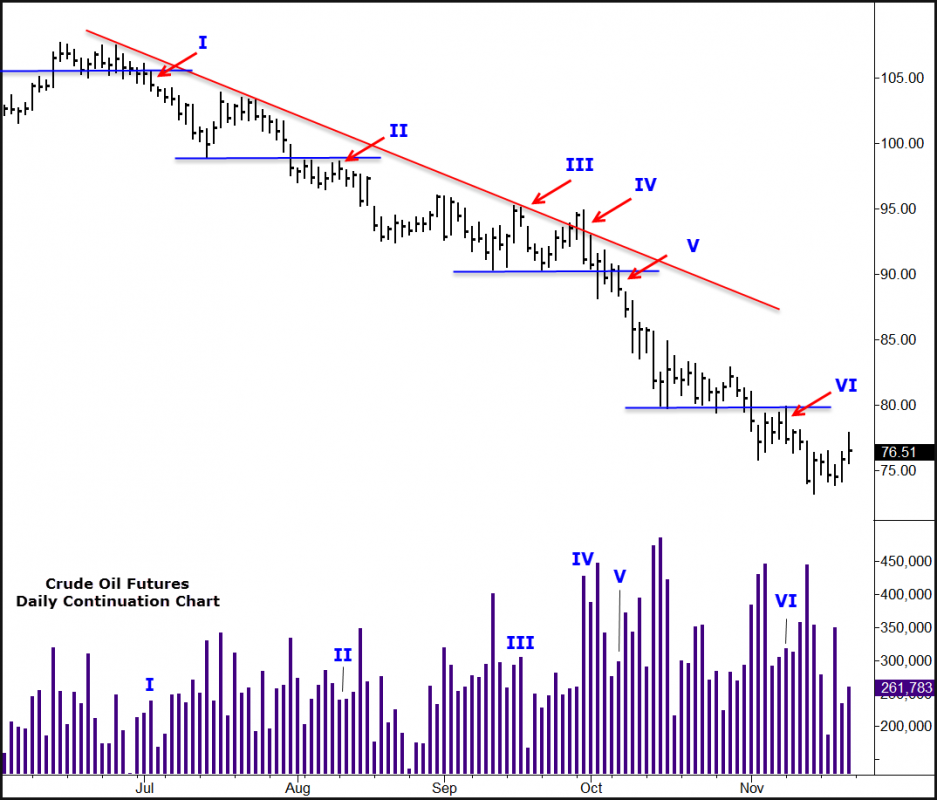
On Bar II, we see Crude unable to rally. Volume is low against prior support which has now become resistance. It’s an ideal location to short.
Bar III shows selling at the downtrend line. Note the high volume and narrow range. We saw this same behavior on the weekly chart. Here it occurs at the well-defined downtrend line. We short this. Although the market rebounds a bit after meeting support, the very bearish action at Bar IV offers another short opportunity as selling volume significantly increases. As the market breaks support at Bar V, another short opportunity arises, though this kind of trade is the least favorable in the Wyckoff playbook. Shorting weak rallies is preferred over breakouts. Another sell setup occurs on Bar VI as the price action is negative and volume increases to the downside. Selling continues to dominate. We are, however, reaching monthly support.
Where Does Oil Go from Here?
At this writing, Crude Oil has come to significant support at about the 75 level. So far, the charts suggest the market will try to hold here. Whether it continues lower or rallies will be told by the next move of the market. These are a few of the Wyckoff Best Trade Setups.
To see more high odds trade setups, please click here.
#####
Related Reading from Dr. Dayton
,

