

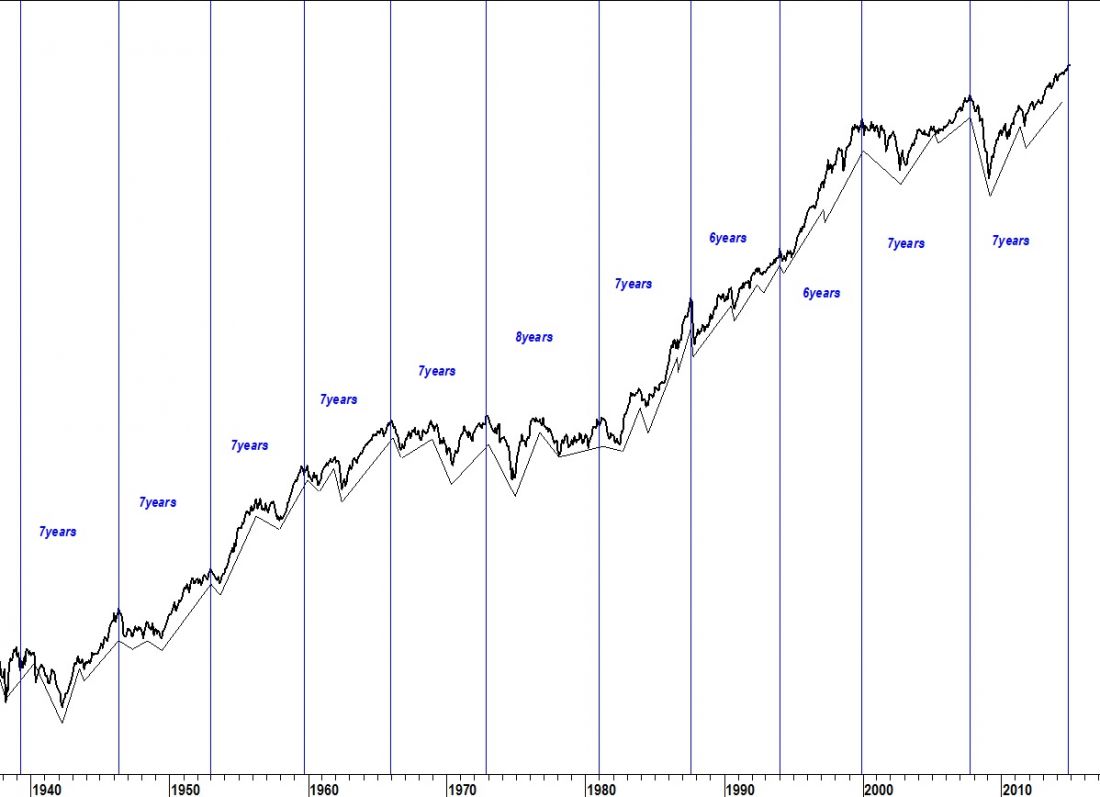
7-Year Cycle Highs
For several decades, the Dow has exhibited a cycle of seven years between highs. It has been as short as six years and, on one occasion, it stretched closer to eight years. All cycle highs matched the highs of Lindsay’s basic cycles. The previous cycle high was in Oct 2007, which makes a cycle high due now. The high should be point H of Lindsay’s long cycle. Past experience implies it could come as late as Oct 2015 but a six-year cycle low makes that very unlikely.
6-Year Cycle Lows
In addition to 7-year cycle highs, the market seems to make a low every six years. The next 6-year low is due in mid-2015.
As the high in 1973 shows (see chart below), in secular-bear-long cycles, this cycle has pointed to highs rather than lows.
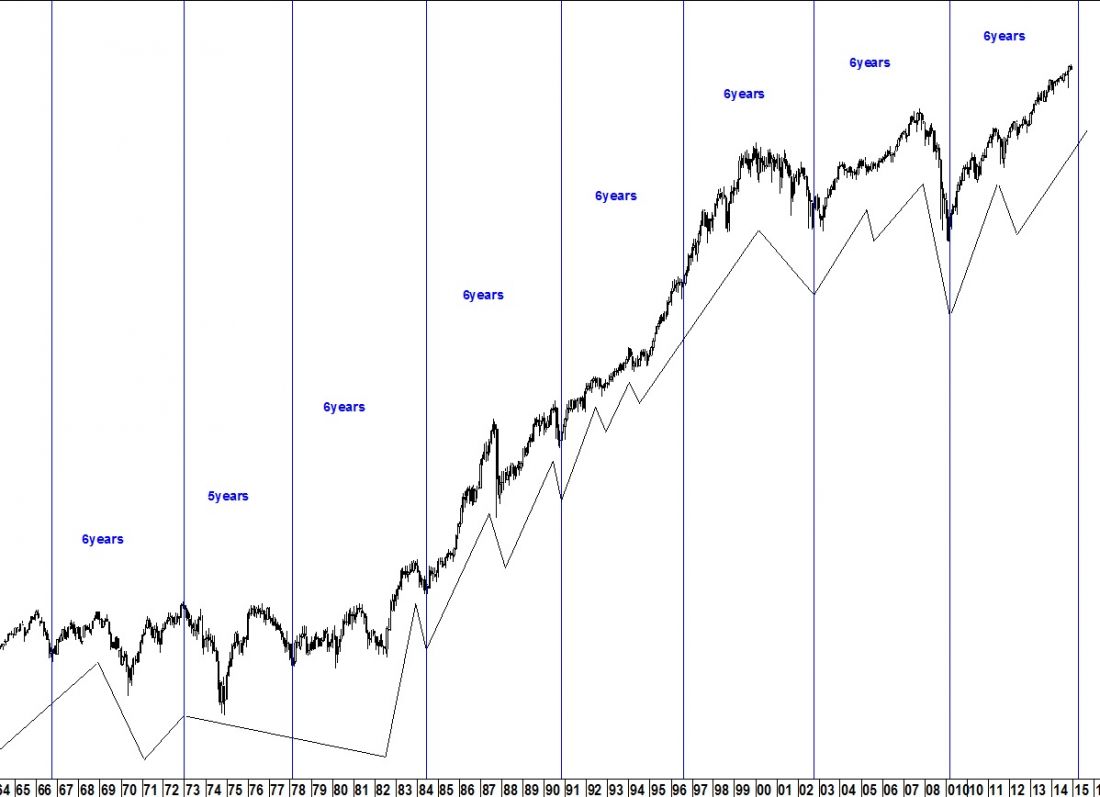
Although Lindsay had nothing to say about these cycles, this phenomenon can be tracked on Lindsay’s long-cycle charts all the way back to 1798. If the Dow has been in a secular-bear cycle since 2002 as expected, the cycle should be pointing to the same high as the 7-year cycle. If the Dow is in a secular-bull cycle, a low is due in 2015. Either way, cycles are now pointing to a top in the Dow.

