

The drubbing in the stock market last week was hard to watch, but as things stand, there isn’t any evidence to suggest it’s more than a dip within an uptrend. And the S&P 500 has quickly come to a natural point for a recovery to occur.
Specifically, price has reverted to the weekly mean (20-week simple moving average), as you can see via Bollinger Bands.
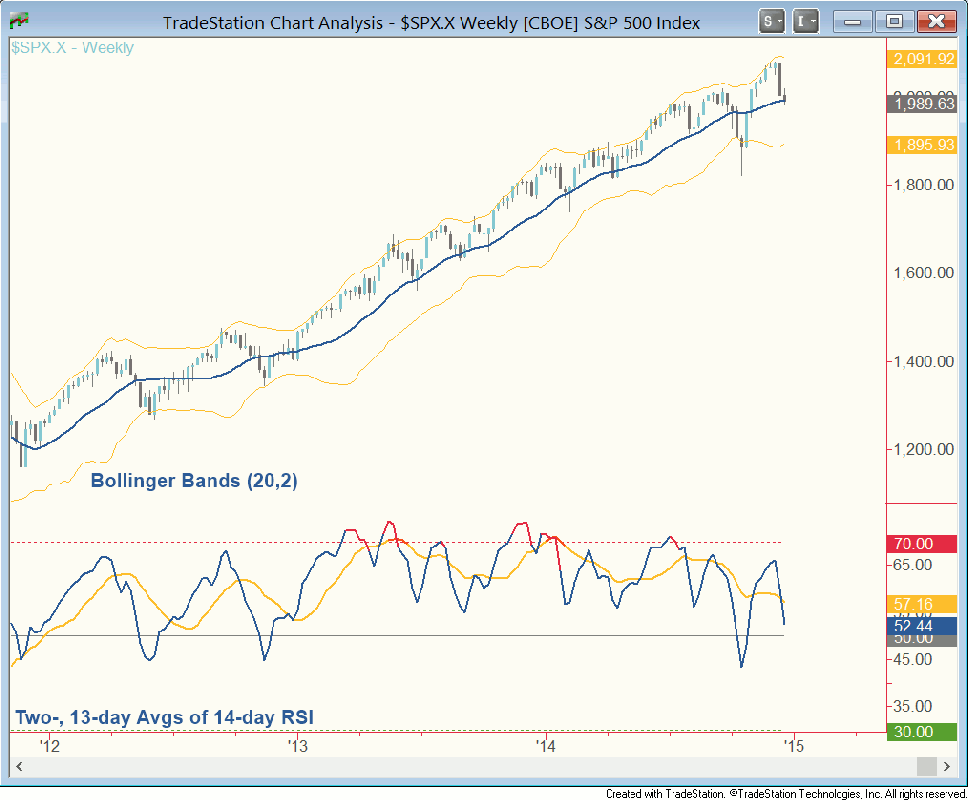
In uptrends, it’s common for price to revert to the mean during pullbacks or consolidations before moving on to the next leg up to higher highs. So tests of the mean often present attractive long entry scenarios. Many dips to the mean since 2013 have preceded rallies.
One point to keep in mind is the slowing momentum since the beginning of the year. You can see this through the decline in moving averages on the 14-week relative strength index at the bottom of the chart. Momentum tends to lead price.
The deterioration in momentum is a reason for caution heading into 2015. Net, swing and position traders should be looking for signs of seller exhaustion in order to go long here, while investors would do well to treat new highs as opportunities to reduce holdings.
Good trading, everyone.

