

For at least two years, we have been long-term Bulls on the S&P500 large cap index (SPX). Sure, we take short-term positions with the Bears. We are traders, and we don’t fall in love with either side, but when it comes to the longer time horizon, we have always called for this rally to continue.
That is, until now.
Now, there are two items in the SPX chart that are making us question if the rally is running out of steam, especially in the medium term. This week should resolve our doubts, one way or the other.
The first hint of a possible future storm is what may be a failure in the V-shaped rebound we have seen recurring in the SPX all year. The V-shaped recovery is essentially a sharp price drop followed almost immediately by a sharp rebound to a new high (See chart below).
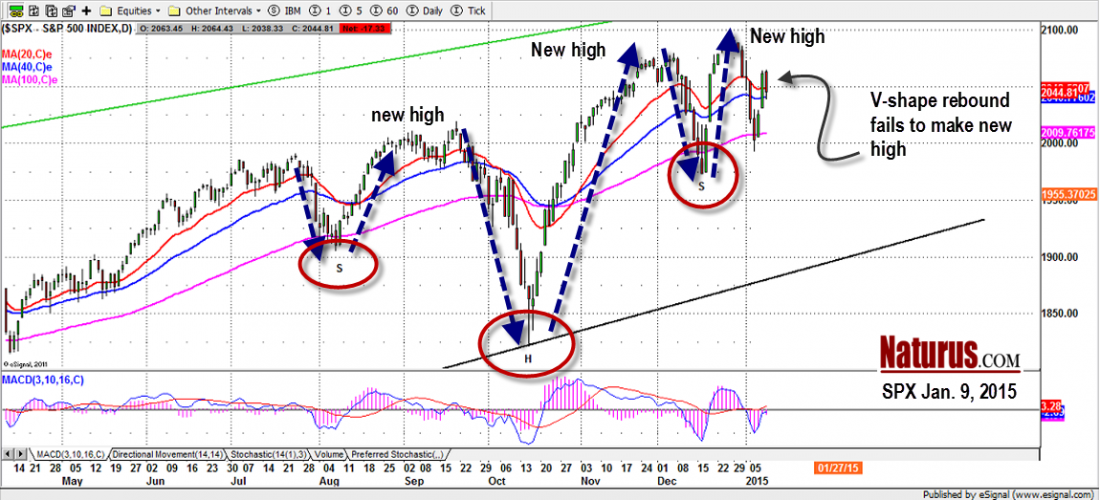
We had the most recent example last week, but this time it didn’t follow the usual script. The recovery rally stopped short of a new high, and then it reversed back down on Friday (Jan. 9). The price action on Friday was quite bearish, and the market closed near the low of the session.
That’s the first straw in the wind. Straw two is the failure – so far – of the bullish inverted head-and-shoulders pattern on the daily SPX chart. Instead of continuing up, it reversed down to the 100-day moving average line before recovering partially. Now we’re waiting for the other shoe to drop.
What To Watch For This Week
The first sign will be a new high in the SPX. It the market makes a new high – and holds it – the Bulls will heave a sigh of relief, tell us we are hopeless worry-warts, and party like its Christmas again. If it can’t make a new high, the market should at least not drop below last week’s low at 1992.
But there’s the downside to consider. The market last week was marked by unusually high volatility and wide price swings. If we see the price drop below 2000, we should be prepared for the possibility of some nasty stop runs and panic selling. Then look out below. That could drive the price down below 1970, which would negate the bullish chart pattern and bring our 1900 target directly into play.
And Another Thing
One other element will affect the price action. The SPX major options expire this week, and there is a very heavy open interest in Puts below the 2000 strikes. Put buyers have been getting murdered for a year. Every time it looks like the top is in, the market comes roaring back in that V-shaped recovery and wipes them out. Despite that, they are back in-force this month. You would think they would know better and maybe all we are seeing is the triumph of hope over experience. Or maybe they know something we don’t know.
We will know by the end of the week, one way or the other.
#####
To get our free Weekly Market preview and to get on the mailing list, please click here.

