

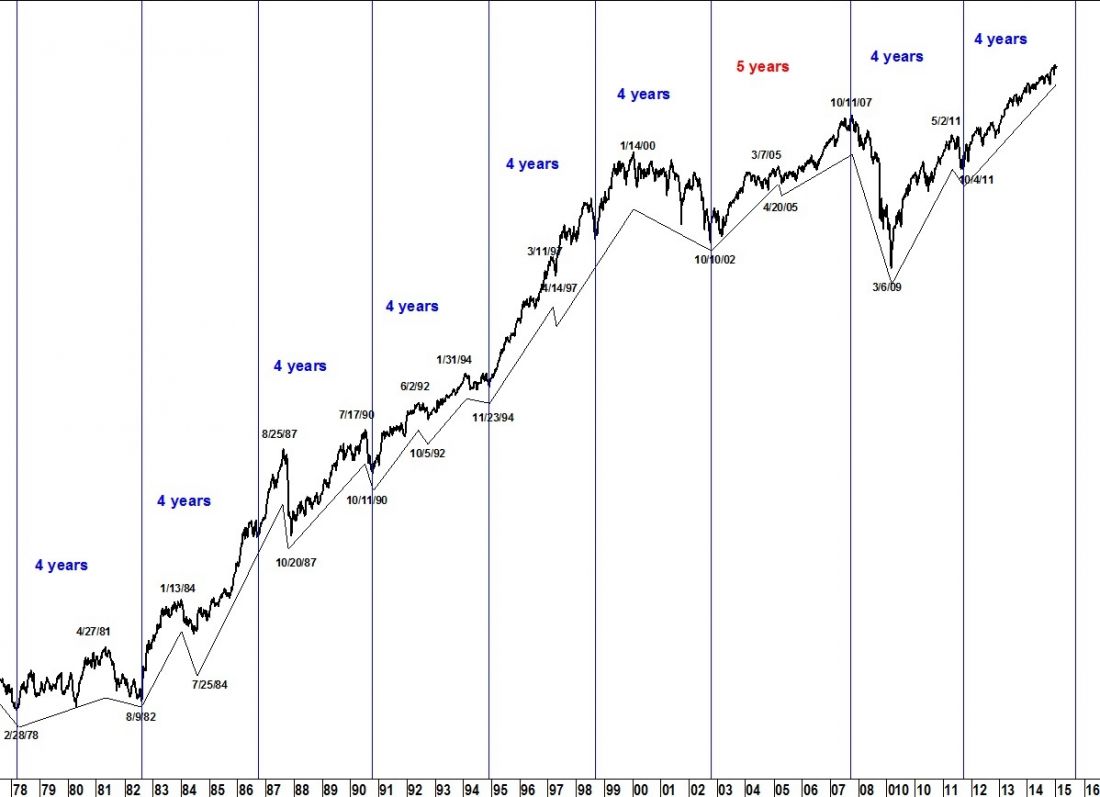
An approximate 4-year cycle, which was identified as early as the 15th century in transatlantic trade, was popularized by Joseph Kitchin in his 1923 text Cycles and Trends in Economic Factors. The 4-year cycle between lows in the Dow can be found throughout the entire history of the index.
The chart below includes one inverted cycle of five years which ended at the high in 2007. The only other inversion in the Dow occurred in 1946.
The cycle calls for a low in 2015 which, despite the historical bullishness of pre-election years and “years ending in 5,” keeps me on guard for a big pullback in equities this year.
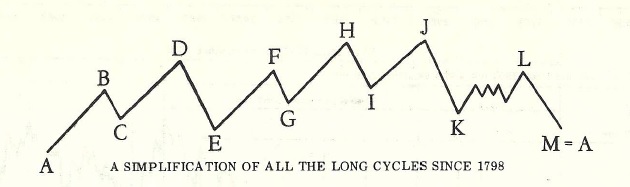
The cycle confirms expectations that an important decline is close to starting (if it hasn’t already), which will be identified in Lindsay’s long cycle as the decline between points H and I. The template below comes from Lindsay’s 1950 paper, An Aid to Timing.
The forecast for a high in equities shown in my 12/29/14 commentary, The Next Tradable Top in the Dow, is playing out as described. The S&P 500 topped that day and the Dow saw its high three days earlier. For details on the forecast for an end to the sell-off, see the January Lindsay Report.
To get your copy of the January Lindsay Report from SeattleTA, please click here.

