
We had a period of increased volatility in mid-December, just like we are having now. Back then I wrote an article discussing how the Average True Range (ATR) of a 60-minute bar in the NASDAQ futures had more than tripled. The point of the article was that sometimes, “More is different.”
In other words, an incremental change in the trading environment can make a qualitative difference in our trading experience and results, as in when a small temperature change causes H2O to shift from liquid to solid.
In December’s article, I pointed out that using normal stops in a high volatility environment is a recipe for quick losses, because you are likely to get stopped out by noise.
There’s another issue you may need to address, however, and that is your basic method might not work.
Limitations of Trend Following
If you use a trend following method, it might not work in this environment because the increased momentum of the price swings may give you false indications of a trend change and whip you around.
Most traders use moving averages and oscillators to gauge trend and pullbacks, and that works well in normal times when we have normal trends. With the bipolar “Naz-crack” off its meds, however, you would do well to add a volatility indicator, such as a Bollinger Band, and to employ a mean reversion method instead of a trend following approach.
Why might you want to consider this?
Fade Rather Than Follow
Mean reversion is the standard way of trading high volatility. Stock traders trade mean reversion when they play gap fills. During the rest of the day, mean-reversion traders “fade” the moves to and from extremes, which means they sell sharp rallies and buy extreme sell offs.
If you want to add mean reversion to your arsenal of trading tools, consider a stacked set of Bollinger Bands consisting of three bands of the same length, but set to different standard deviations. Like this.
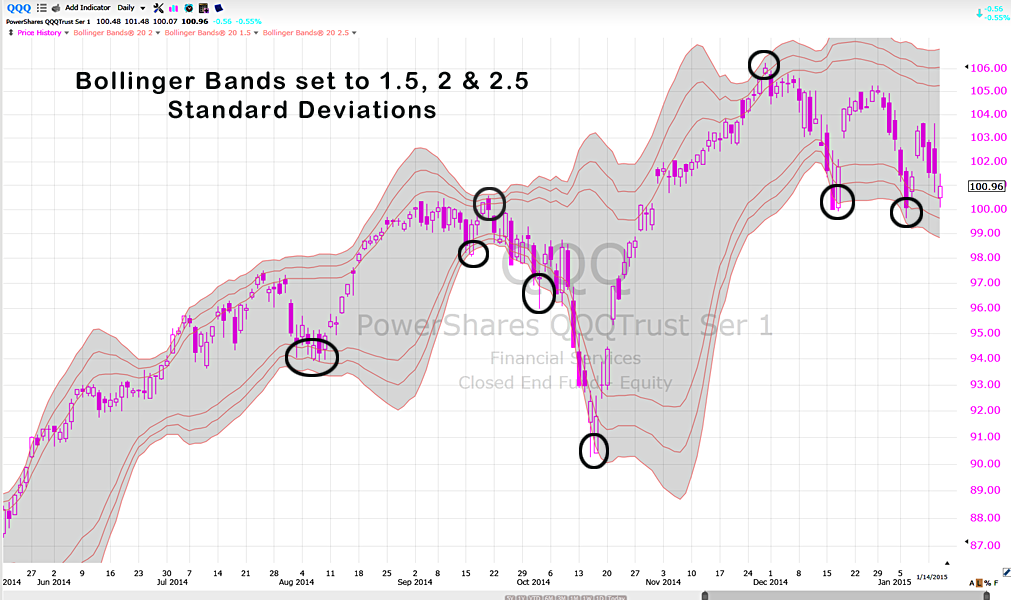
The above is a daily chart of the NASDAQ 100 tracking stock (QQQ). An excursion to the 2.5 standard deviation, for example, has a very good chance of reversing because it is statistically at the bleeding fringe of probable prices.
#####
And by the way, if market volatility is driving you crazy, please click here.

