

I’d like to revisit two beloved names, both of which I’ve written about in recent articles AAPL and LNKD.
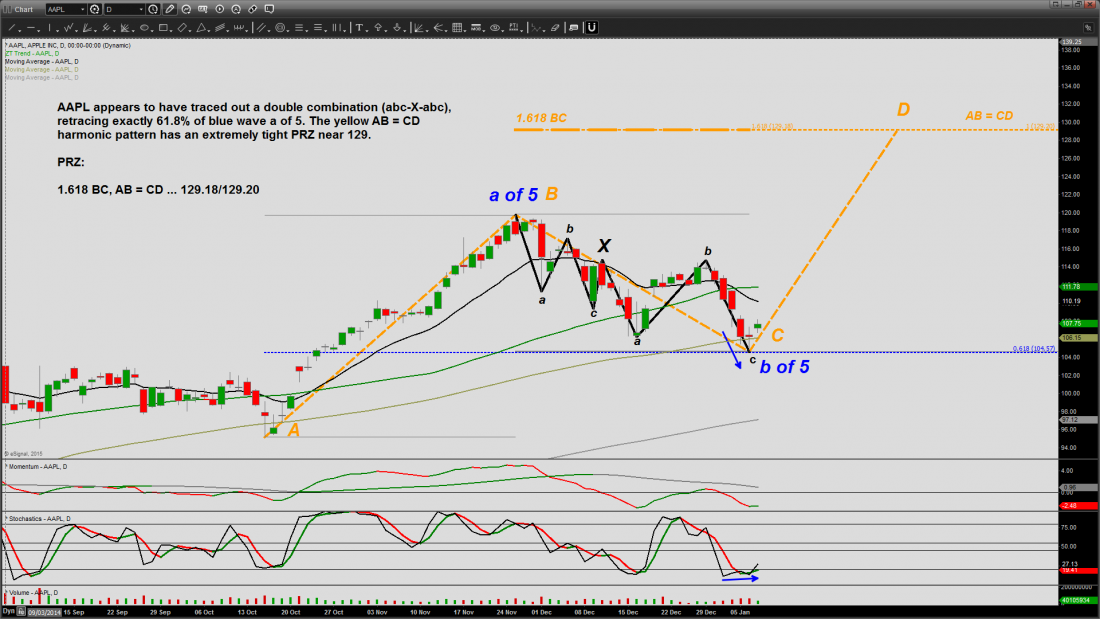
I mentioned in a recent article about AAPL, “The Five Percent Day” that wave 5 was underway and aiming for a target of 124-131. But I also said that just like its predecessors wave 1 and wave 3, wave 5 must also subdivide into a zigzag (a-b-c) structure (I made use of Ian Copsey’s Harmonic Elliott Wave model vs. the classic R. N. Elliott model).
Sure enough, AAPL pulled back by an exact Fibonacci 61.8% relative to the last up leg (wave b relative to wave a of the a-b-c structure). This is depicted in the chart below. Should my analysis prove correct, blue wave c of 5should now be underway, having its sights set on the prize. I’ve also interpreted the price pattern in yellow as a harmonic “AB = CD” pattern possessing a particularly tight PRZ (Potential Reversal Zone) of 129.18 to 129.20. With that said, there’s no guarantee blue wave b of 5 has ended. However, its internal structure appears to have subdivided, so far, into a double combination, abc-X-abc, whereby the first abc is a zigzag, and the second abc a flat. And because double combinations rarely ever morph into triples, the odds are on the bulls side for now, despite the current market weakness and volatility. (Note: both the zigzag and the flat are well-known corrective structures in the Elliott Wave catalog of chart patterns).
As to my revisit with LNKD, my December 19th article, “A Deep Look At LNKD“, appeared to be on the money. But sadly, that very same day proved to be the top. My TradeWinds subscribers did profit handsomely from the most recent run-up of almost 40 points. However, as we patiently awaited a profit-taking pullback to the mid 230’s and an eventual resumption of the uptrend, it suddenly became clearer and clearer that the once-brilliant forecast was doomed for failure.
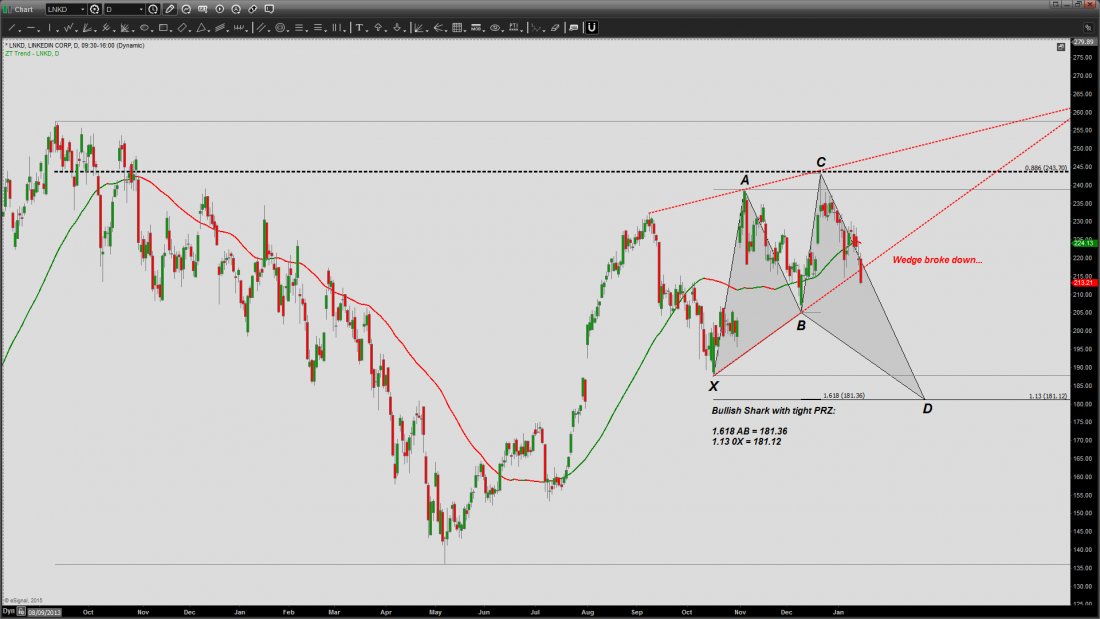
The chart below (see bottom of page) reveals a rising wedge chart pattern that has finally shown its hand by clearly breaching its lower trend line. Based on Thomas Bulkowski’s guidelines for this particular pattern, the downside target is the pattern’s inception point, point X. Also depicted in the chart is an harmonic chart pattern, the five-point bullish Shark (X-A-B-C-D), possessing a pretty tight PRZ of 181.12 to 181.36. But this pullback could very well be in the context of a larger-degree bullish formation whose details will be the subject of a future writing.
And as I’m often asked, why would the Shark formation whose downside objective is ~181 be dubbed bullish? The answer is because a bullish reversal is to be expected upon completion.
As we all well know, no one’s technical analysis is infallible. After all, a technical analysis is no more than the trader’s own interpretation of the price action. When the subsequent action invalidates a technical setup, the trader must adapt quickly to changing conditions. And that’s precisely what we did based on the chart below.
#####
For more analysis from Peter Ghostine, please click here.

