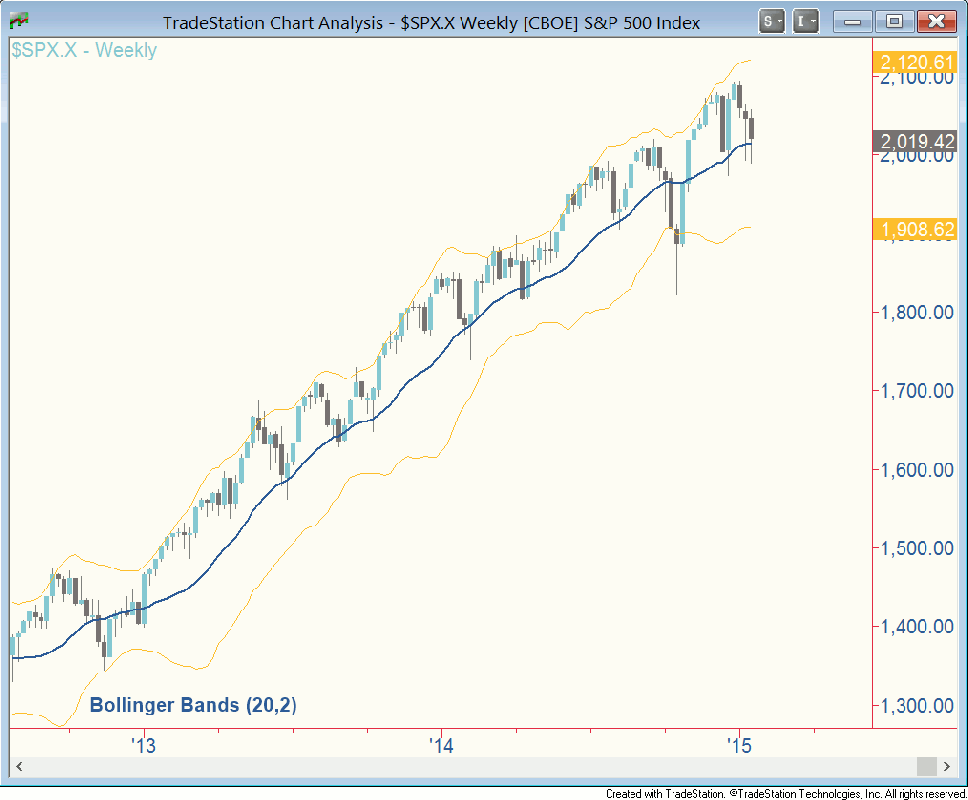
The increased volatility and wide price swings in equities since the beginning of December reflect high emotion and a state of confusion in the crowd. Often the best time to buy is when you’re most afraid. Technical conditions indicate this is probably one of those times.
To start, the S&P 500 chart shows two consecutive lower shadows confirming demand at the weekly mean (20-week simply moving average). In uptrends, reversions to the mean are often followed by rallies to higher highs. Additionally, the 60-minute chart (not shown here) illustrates a marked improvement in momentum.
Pick your oscillator – MACD, stochastics, RSI – and you’ll see that last week’s low in SPX was accompanied by higher lows in momentum compared with early January, amid oversold conditions that signal a point of seller exhaustion.

Finally, Germany’s DAX Index has rallied past its 2014 highs (I had been looking for more downside in the near term before it righted itself, but the recovery has been quick). This is bullish because the U.S. has been taking cues from the Eurozone as fears of Greece leaving the monetary union resurfaced. On balance, crude oil still looks bearish, and the staggering drop in this market has been a cause for caution in the stock market.
So far, 2015 is looking like a more difficult year than 2014, and profits in the market will require a lot of effort. My guess is that the best approach will be to target a series of modest gains, moving in and out of the market, rather than buying every dip and sitting back.
Good trading everyone.


