

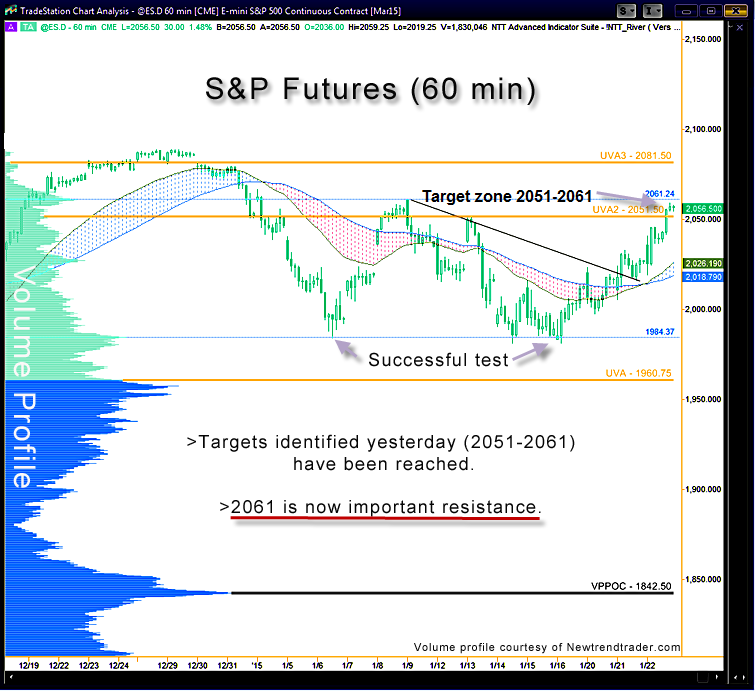
On Thursday, the S&P 500 futures followed through on the anticipated move up to the 2051-2061 zone. The key level now is 2061. That level is determined by the small green peak on the volume profile seen on the left side of the chart below.
The 2061 level has been in place for several months. It’s an area where we can expect selling to occur.
This profile encompasses more than a year of transactions, so it provides an objective context for understanding support and resistance. A move above 2061 and a successful retest would bode well for higher prices. In the meantime, it’s the ceiling.
A Note on Volume Profile
The histogram on the left side of the chart shows the volume distribution in the S&P futures for the entire year of 2014 through today. Key levels are indicated by the peaks and troughs.
#####
To contact Dr. Reid for a primer on using Volume Profile, please click here.

