

With Google’s (GOOGL’s) earnings release date just around the corner (January 29th), I thought I’d take a close look at the daily and weekly charts in hopes of offering a useful technical interpretation of the price action on both the intermediate and short-term time frames.
The daily chart below sports a bullish BAT harmonic pattern that confirmed on two separate occasions by dropping below black point B (price = 511). However, when it comes to trading, things are never quite this straightforward. Within this massive formation, a smaller-degree countertrend pattern, namely, a bearish SHARK, appears to be unfolding with its sights set at a tight Potential Reversal Zone (PRZ) of ~576/578. Why is this price zone critical from a technical standpoint?
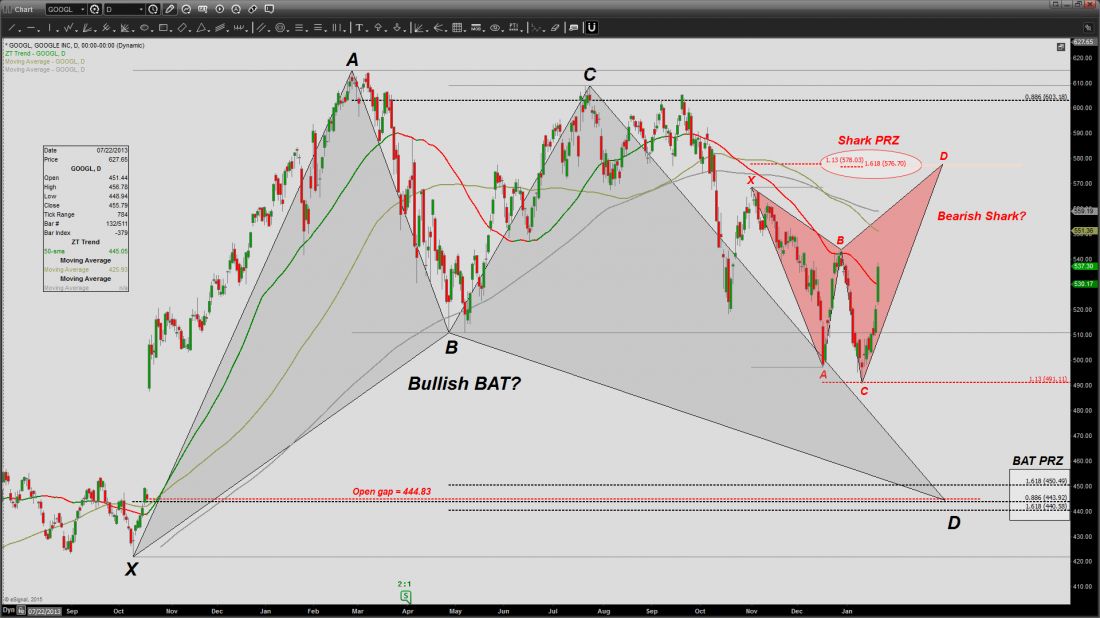
Two harmonic patterns are at play: a bullish BAT with a price objective (aka. PRZ of ~440-450) and a smaller-degree bearish SHARK aiming for the ~576-578 price zone.
In the weekly chart below, I expanded my analysis to emphasize the double top pattern and include two parallel trend channels that had previously guided my trading decisions in this name. Notice how the bullish BAT‘s black point B almost back-tested the top of the black channel, bouncing off the 50-week moving average back in April 2014. Black point C subsequently established the double top, setting the stage for yet another back-test of the same channel and a decisive breach of the 50-week moving average below which the stock has remained ever since.
So, what to make of this recent pre-earnings strength? If the weekly chart is indeed bearish, the Shark pattern‘s likely objective is to back-test the underside of the blue channel as early as next week at precisely the bearish Shark pattern’s PRZ of ~576/578. Moreover, trend traders should take note of the downward-sloping 50-week moving average, a preliminary indication of a recent trend change. A short-lived move north of the downward-sloping average could very well set up what is often referred to as a rubber band trade.
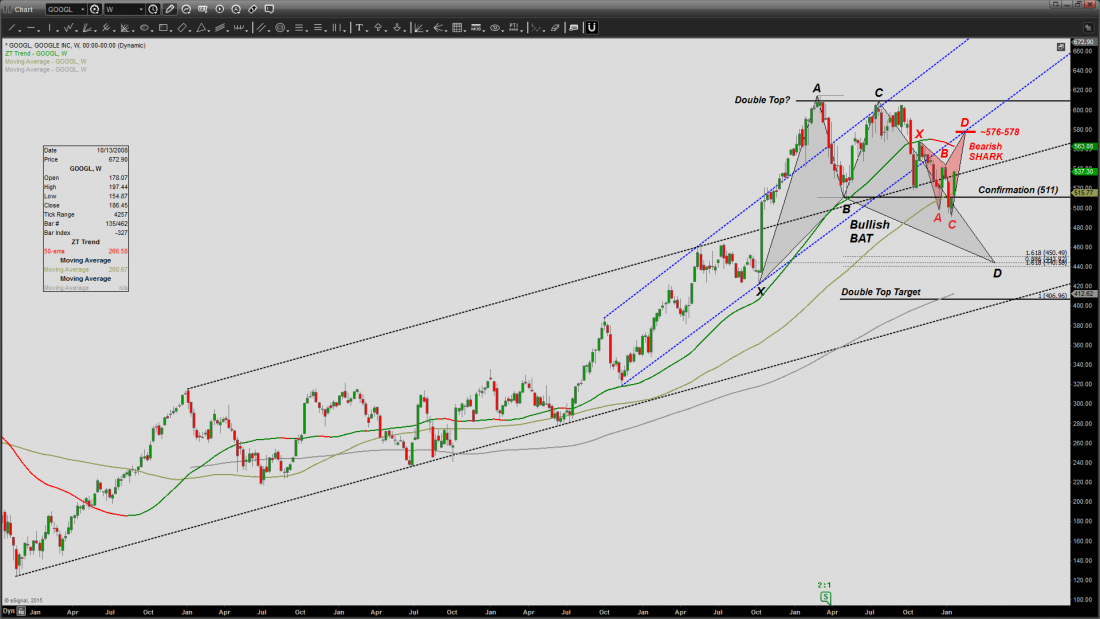
A massive double top. The black channel contained the decline on two separate occasions. The red SHARK appears to be aiming for a test of the blue channel’s underside at ~576-578.
And as I’m often asked, why would the SHARK pattern whose upside objective is ~576/578 be dubbed bearish? The answer is because a bearish reversal is to be expected upon completion. It’s also worth noting that the SHARK pattern often unfolds as a relief/short-covering rally against the prevailing trend.
As we all well know, no one’s technical analysis is infallible. After all, a technical analysis is no more than the trader’s own interpretation of the price action. When the subsequent action invalidates a technical setup, the trader must adapt quickly to changing conditions. And that’s precisely what I did based on the above charts. As of this writing, I’m long a February (monthly) put spread and a weekly (January 30th) call spread.
#####
For more from Peter Ghostine, please click here.

