

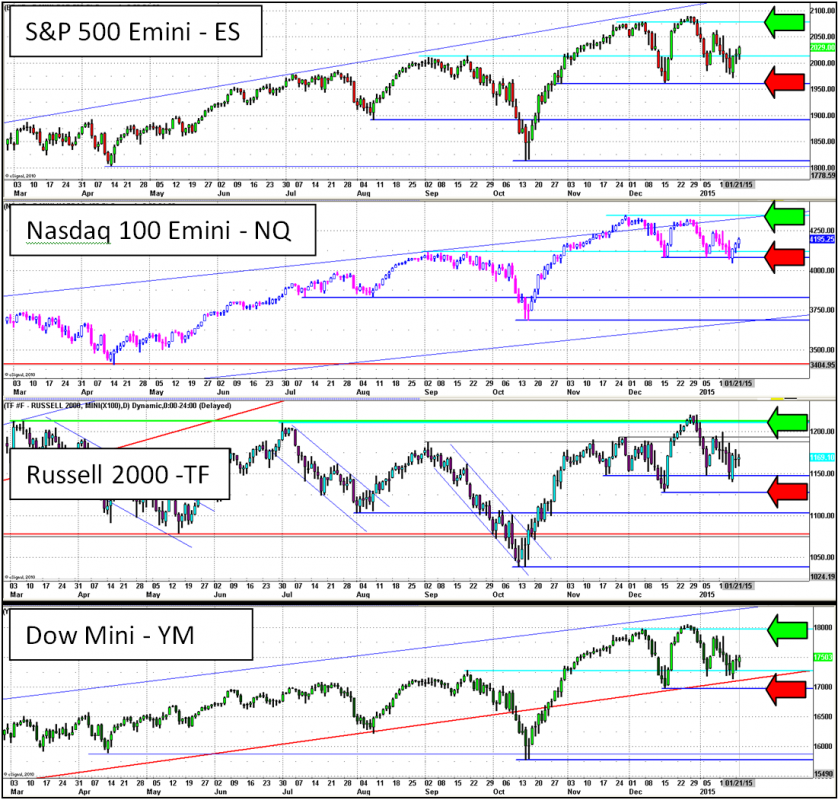
The stock-index futures remain above critical supports (red arrows) and below the recent highs (green arrows). A move above the January highs is needed in order to prove that a sustained rally is underway. A breach of the support levels (red arrows) would instead shift the bias in stocks to firmly bearish. I anticipate the resolution of these ranges in the stock indices will lead to a directional / trending move in the direction of the break.
The S&P 500 (ES) is working higher and is in the middle of the recent range above 1960 – 70 and below resistance at 2079 – 88. The move off the recent swing low takes off the selling pressure for now, but the resolution to this range is what will be key for the index as we look ahead. A resolution to the upside (along with the other indices following) would be a major positive for stocks while a resolution to the downside would be a substantial negative in the big picture. While within this range, I anticipate further two-sided price action, as the bulls and bears fight it out.
The Nasdaq-100 (NQ) maintained the critical support zone at 4043 – 82 and is moving toward the robust zone of resistance at the top of the current range is 4312 – 48.
The Russell 2000 (TF) is within its rotational trading range and has not been participating the last few sessions in the push higher by the S&P 500 and Nasdaq-100. I continue to look for the resolution by the TF of its current range to be a signal and barometer of a continuation of upside gains or an anchor and leader of downside losses. Critical support remains at 1128 with primary resistance at 1195 and 1212.
#####
For more analysis and information, please click here.

