

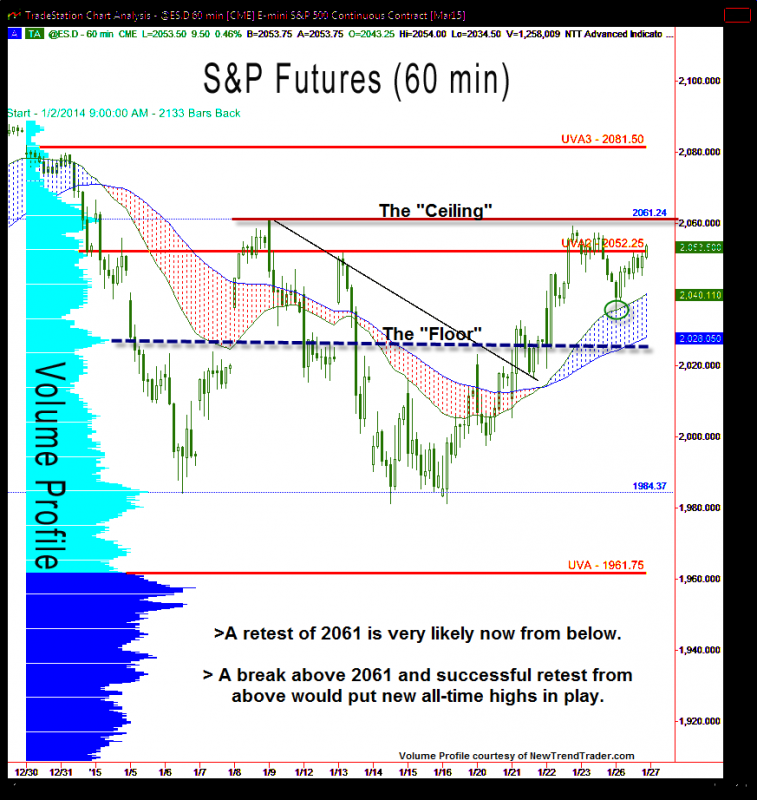
On Sunday evening, the S&P 500 futures sold off quickly and approached the 2023 level I mentioned as the lower target zone for Monday. Early in Monday’s day session the upper level of that target zone (2035) was tested and the market passed the test. You can see this level on the chart at left circled in green.
This puts the 2061 “ceiling” level in play as a target. If the S&P futures surpass that level and then hold it on a test from above, the market is likely to then make new all-time highs. If 2061 cannot be breached, then the current consolidation will continue.
A Note on Volume Profile
The histogram on the left side of the chart shows the volume distribution in the S&P futures for the entire year of 2014 through today. Key levels are indicated by the peaks and troughs.
If you would like to receive a primer on using Volume Profile, please click here.

