A relative strength analysis versus the S&P 500 shows large-cap technology stocks have been outperforming the broader market since 2007. There isn’t any sign of that changing. Within the context of the cyclical bull market, QQQ (PowerShares QQQ Trust) peaked in late November and began to pull back. After multiple tests of technical support attracted buyers, the reward-to-risk scenario for long entry is attractive for buying the dip.
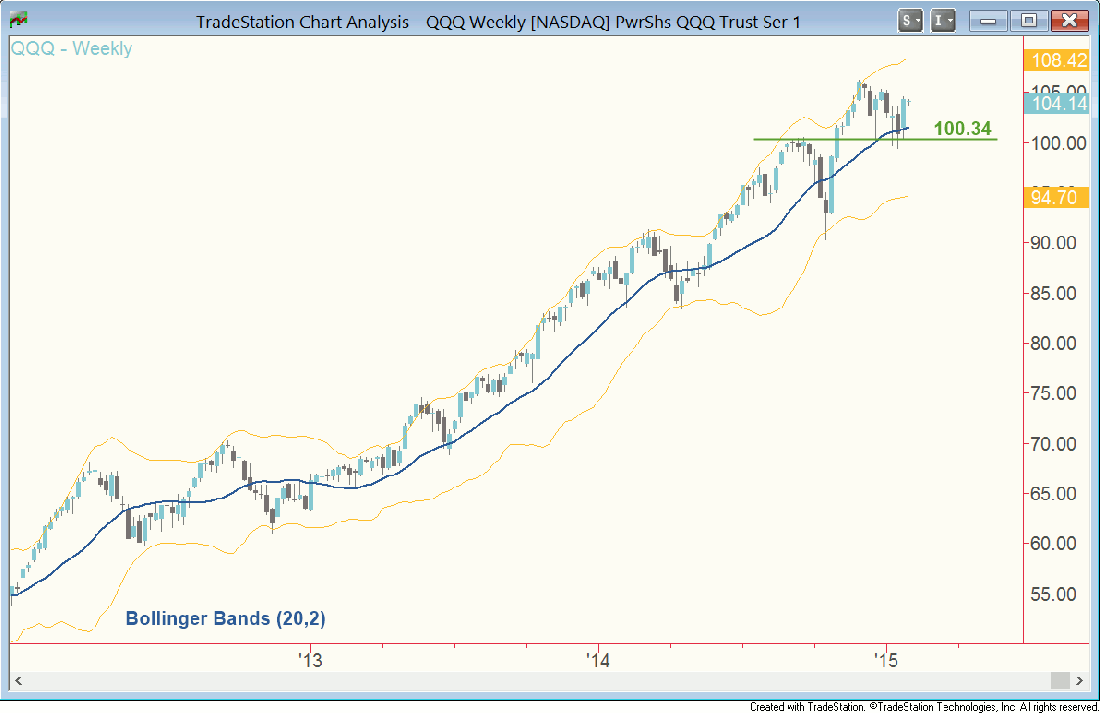
As the weekly chart below illustrates, QQQ has established a floor around 100.00. Note the numerous lower shadows.

This confirms chart support at 100.34, based on the highs in September. Additionally, price stabilized at the weekly mean (20-week simple moving average) – the blue midline of Bollinger Bands on this chart. In uptrends, reversions to the mean are often followed by rallies to new highs. The mean is sloping upward and has been rising uninterrupted since February 2013, affirming a strong trend.
This scenario is appropriate for a position trade. One exit strategy to consider is holding until the weekly mean turns down. Whether it’s this or another technique, be sure to employ some mechanism that keeps your emotions out of your decision making.
Good trading everyone and all the best.


