

The 2061 “Ceiling” level was not tested on Tuesday due to the gap down in the markets, ostensibly from a shortfall in earnings and durable goods orders.
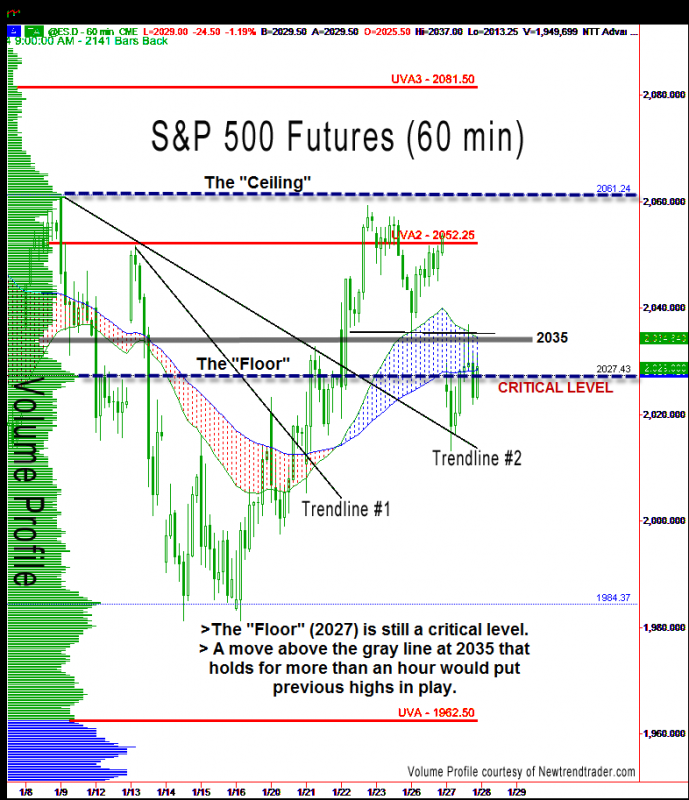
If a “Ceiling” is rejected, you can bet the “Floor” will be tested, and that’s exactly what happened on Tuesday. It was briefly undercut, but an important downtrend line held (Trendline #2) and provided a platform for a bounce.
In post market action, Apple did not disappoint and index futures are up. The key support levels for Wednesday are the gray line at 2035 and then the “Floor” itself at 2027.
If 2035 holds, then 2052 is in play. However, another move below the “Floor” increases the odds of much lower prices (1984 and then 1962).
A Note on Volume Profile
The histogram on the left side of the chart shows the volume distribution in the S&P futures for the entire year of 2014 through today. Key levels are indicated by the peaks and troughs.
#####
If you would like to receive a primer on using Volume Profile, please click here.

