

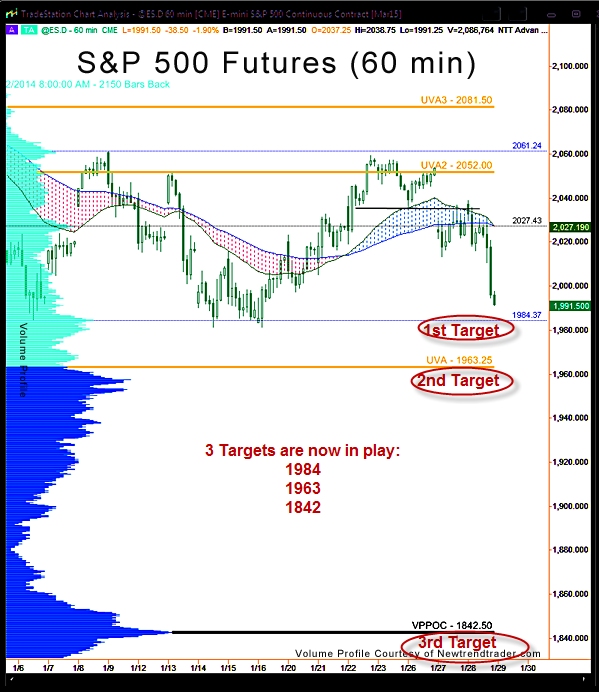
As I noted yesterday, “another move below the Floor increases the odds of much lower prices (1984 and then 1962).” The Floor support at 2027 was tested for several hours on Wednesday, but turned into resistance after the FOMC announcement.
- This puts three levels in play to the downside: 1984, 1963 and 1842.
A Note on Volume Profile
The histogram on the left side of the chart shows the volume distribution in the S&P futures for the entire year of 2014 through today. Key levels are indicated by the peaks and troughs.
#####
To contact me for a primer on using Volume Profile, please click here.

