

Last Week
The S&P 500 cash index (SPX) closed at 2096.99 last Friday, up 41.52 points for a net weekly gain of 2%, continuing a strong rally from the beginning of the month.
The large-cap index has broken out of a medium-term range-bound pattern that extends back to November, 2014. What we’re looking for now is confirmation that the break-out is real, and not the kind of nasty head-fake traders hate.
We were talking about this all last week. Thursday (Feb. 12) the SPX decisively broke the triple resistance line at 2080; Friday it made a new high for this year. The index has been held under 2080 since January, and has tried and failed to break above this level in four previous attempts. Obviously, such strong resistance is important, and the break-out is a significant event. This week we want to see a follow-through to confirm that breakout.
This Week
There are positive signs. One indicator of wider support is the rally in the Russell 2000 Small Cap index, which reinforces the short-term bullish outlook. There is also good strength in the upside momentum, and public sentiment – for what it’s worth – is also strong. If the SPX breaks above 2100 this week it will be reaching for the next target around 2130-2170.
Futures
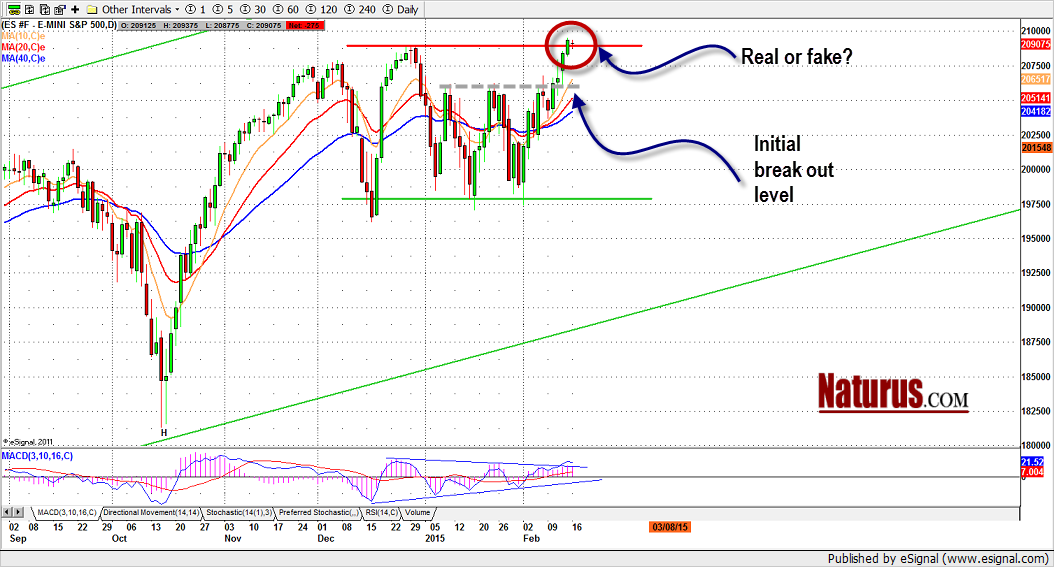
The same triple top/triple bottom pattern appears on the S&P mini futures (ESH5) chart (see below). Breakouts from this type of pattern are usually followed by a new trend in the direction of the break-out – in this case up – and that’s what we expect here … if this break-out is real.
The ESH5 (the March e-mini contract) broke the 2088.50 resistance on Friday and closed above it by five points. Friday’s price action was bullish, but five points is not entirely convincing for a chart pattern that is notorious for false break-outs – especially when the break-out occurs with the lowest volume in five days, as it did Friday.
Our nervousness was exacerbated by the Monday night action in the European market. The US markets were closed Monday (Feb. 16), but in Europe the finance ministers from the European Union were meeting with the finance minister of Greece, and they failed to find enough common ground to even issue one of those meaningless anodyne statements that usually follow such bun-fights.
The ESH5 dumped 10 points on the Globex market as a result, before finding some modest support around 2082.
What We Expect Now
Today we may a minor pullback in the early sessions. The 2065-68 zone will be a key support zone for this week. As long as this zone holds ES up, the rally could resume in the later days.
A failure to hold above this zone could give traders the impression the ES may return to the rectangle pattern and the sideways range. Conversely, a break above 2100, especially on higher volume, will give final confirmation that Friday’s breakout was real and could move the price higher up to 2108-10.
- Major support levels: 2065.50-68, 2050-52, 12015-16.50, 2000-1998.50
- Major resistance levels: 2093.75-96.50, 2109-12.50, 2125-27.50
Significant Data Points This Week
- Major option expirations. VIX options expire on Tuesday, SPX on Thursday, ES monthlies on Friday. All are likely to increase volatility and choppiness in the ESH5.
- The minutes of the last FOMC meeting will be released Wednesday. The market will be watching for clues to the Fed’s intentions about interest rates. The appearance (or non-appearance) of the word “patience” will be regarded as important by the algos. We expect the March FOMC meeting to confirm the rate increase
- The cease-fire in the Ukraine took effect Feb. 15 but seems unlikely to hold. Notably the US, the most belligerent of the external parties, played no part in arranging the truce. Europe now gives the appearance of pursuing an program that is different from America’s.
- The Baltic Dry Index is dreadful. The Baltic Dry is one of those yardsticks that actually measures something important in the real economy (the value of bulk cargo shipped world-wide). On Friday it dropped to an all-time low, after falling like a stone for 53 of the last 55 days. The Chinese New Year this week means it will probably fall further in the short term. Commodity shipping is now so slack one leading Chinese shipper broke up eight vessels – including three large bulk carriers – in January and sold the remains for scrap.This is not a good sign for the economic “recovery.”
ESH5 Mini-Futures Feb. 13, 2015 Daily Chart.
#####
Naturus.com publishes a free weekly analysis of US equity indices. Click here to get on the mailing list.

