

“Given the uncertainty involved in two separate (but very close) date clusters for possible lows to the Dec. sell-off, it seems best to consider the “official” forecast for the next low to be sometime between Jan. 26and Feb. 3.” – January Lindsay Report
With the February 2nd intra-day low at 1,980 the forecast for a low has worked well. The February Lindsay Report laid out the case for a tradable high early this week. My own Hybrid Lindsay model (which combines Lindsay’s middle section counts with traditional cycle analysis) calls for a tradable high Feb. 16-18. It can be a few days early or late so let’s call it sometime this week. Look for the subsequent pullback to last until the 14-month and 21-week cycles bottom in March.
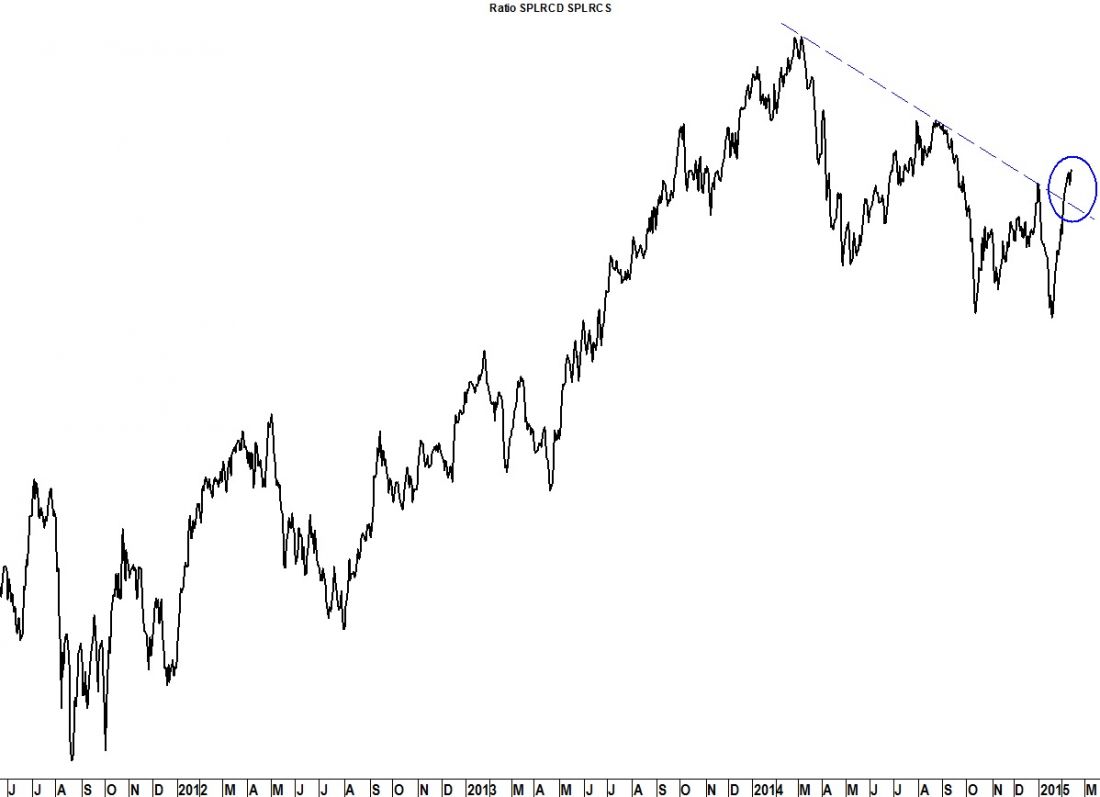
With last week’s breakout to new highs in the NASDAQ, SPX, RUT, and the break of the 2014 bear trend in relative performance of discretionary versus staples (chart), we have to be prepared for the likely extension of the 2009 bull market to higher highs this summer.
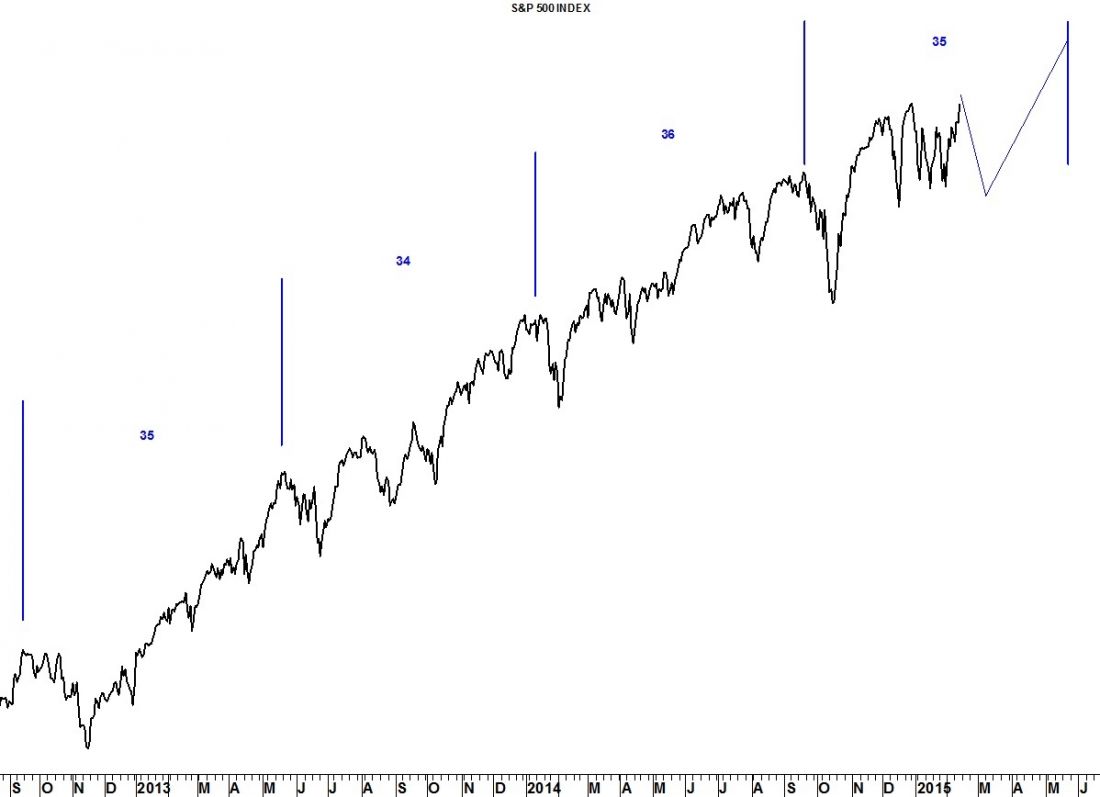
After the expected pullback, equities are then expected to rally until a 35-week cycle in the S&P 500 points to the next tradable high occurring in late May (give or take a week).
#####
For a “sneak-peek” (trial subscription) at Seattle Technical Advisors.com, please click here.

