

Volume Profile is most useful in determining support and resistance during pullbacks. Now that Apple (AAPL) is correcting, let’s take a closer look at its key support levels.
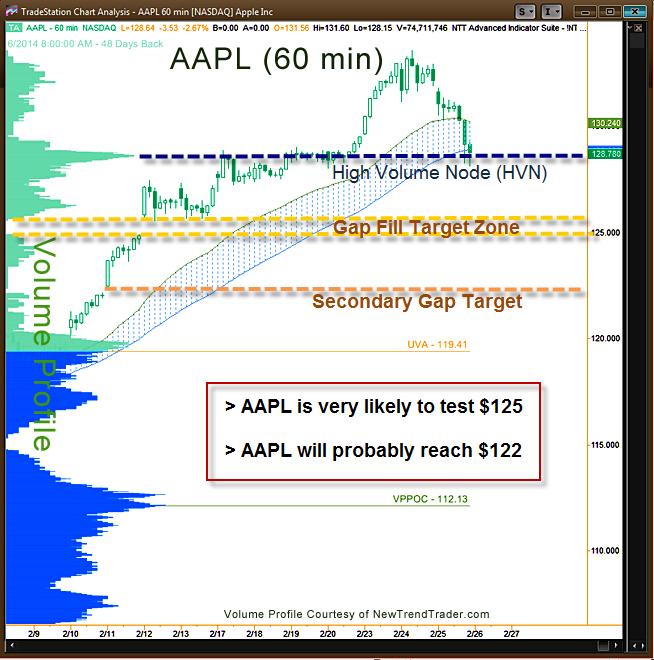
AAPL has strong support at the High Volume Node (HVN) at $128.63, and the stock closed just above that level on Wednesday. But High Volume Nodes are like double edged swords; they cut both ways. As long as price is above the Node, it acts as strong support, but sentiment can turn on a dime, if price spends too much time below the HVN. With a node of this shape (high kurtosis), the ensuing move down would resemble panic.
On Wednesday, AAPL tested the HVN, but did not break it. If AAPL does break it, and I think that’s very likely, the next target is the gap at $124.92. The odds of a gap fill are quite high considering that the Nasdaq 100 futures (NQ) most likely have a date with 4416.
Moreover, it is possible AAPL will reach my Secondary Target at the lower gap at $122.15.
A Note on Volume Profile
The histogram on the left side of the chart shows the volume distribution in the S&P futures for different periods of time. Key support and resistance levels are indicated by the peaks and troughs.
####
If you would like to receive a primer on using Volume Profile, please click here.

