On Tuesday Fed Chair Janet Yellen went before the Senate Banking Committee to provide semi-annual testimony about the economy and the Fed’s role in it. The central question for many market participants is whether the onset of Fed rate hikes, or “lift off” is near. Many metrics the Fed had previously cited as thresholds that needed to be crossed for rate hikes to begin have already occurred.
For example, as noted in Yellen’s opening statement, “…The unemployment rate now stands at 5.7 percent, down from just over 6 percent last summer and from 10 percent at its peak in late 2009.”
Given general economic improvement, many interest-rate traders had been expecting rate hikes to begin in June, in spite of low inflation. In fact, after the testimony, several analysts/news services commented that the Fed had opened the door to a June hike. Certainly, the Fed chair gave herself flexibility by noting that the Fed was considering data on a “meeting-by-meeting basis.” However, the reaction in the market shows considerable skepticism about both the timing and magnitude of rate hikes.
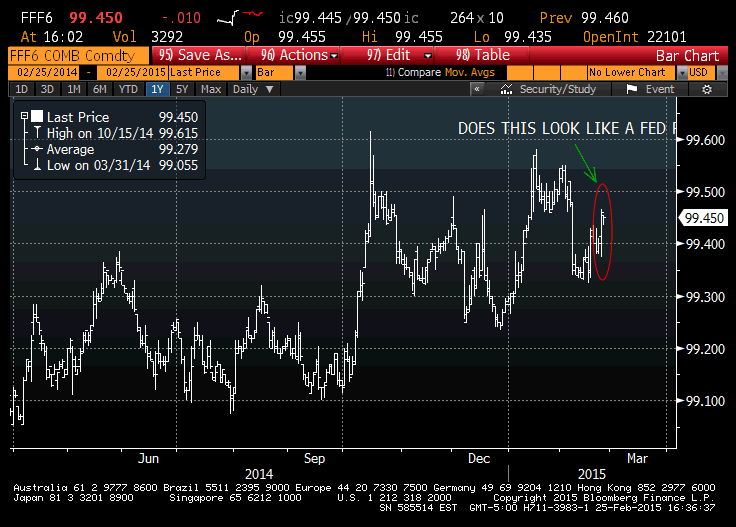
CHART OF FFF16, JANUARY 2016 Fed Funds

For example, consider January 2016 Fed Funds. The settlement Tuesday was 99.460, up 6 bps after Yellen’s Senate testimony. In yield terms, this is 54 bps. The near FF contract, February 2015, settled 99.885 or 11.5 bps. The Fed effective rate has been 11 to 12 bps (FF contracts settle to an average of the daily Fed effective rate over the calendar month). On Wednesday, February 2015 FF again settled 99.885 and January 2016 settled 99.445. The point is, at a price of 99.445, the contract is only 44 bps away from the expiring contracts. The implication is that there is less than 1/2% of tightening priced in over the rest of the year. Note that there are seven FOMC meetings prior to the January ’16 contract. Even if we exclude the March and April meetings (given that Yellen indicated they’re off the table), there are still five meetings. In December, the Fed’s own projections, the so-called dots, averaged an end of the year FF projection of 1.125% for 2015. The difference between the Fed’s own projections and the market’s pricing remains wide.
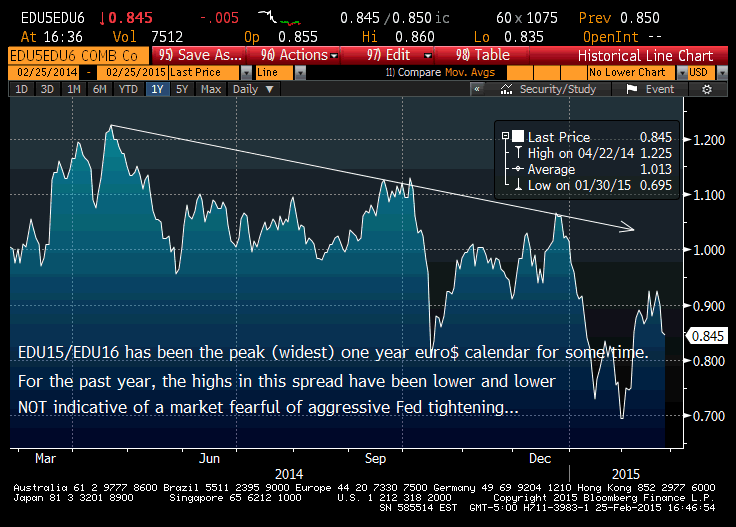
CHART OF EDU15-EDU16, one-year calendar spread Sept’15 to Sept’18

In another example, the peak one year euro-dollar calendar spread has been September 2015 to September 2016. This makes sense as the market expects hikes to begin mid to late 2015. However, this spread is now only 84.5 bps. Simplistically, one could say that the market expects less than 1% of tightening over that one year span. In fact, the highs in this spread have been lower and lower over the past year, and in the wake of Yellen’s testimony, the spread actually declined nearly 10 bps. Once again, the conclusion is that the market is more concerned about declining inflation and subdued growth than the Fed. Without question, we know the market can readjust quite quickly if circumstances warrant. However, the message from the market for the time being is: slow and steady.
#####
For more information on Alex Manzara, please click here.


