

Most technical traders want to know how to be able to anticipate a Topping Market or Bear Market, and when a Bull Market is starting to develop after a correction or longer Bear Market. This requires the use of a longer term indicator, so that the cycles of the market or the company’s stock are visible.
The advantages of the Detrended Price Oscillator (DPO) for Cycle Analysis is that it can lead price and expose the weakness within a long-term or intermediate-term trend before the correction commences. In addition, the DPO works both on indexes, as well as individual stocks. This makes it highly useful for technical traders, futures traders, and long-term investors, and it can be applied to most financial market instruments that have charts for cycle analysis.
When using the DPO, or any indicator, make certain the Aspect Ratio of the chart is consistent with the Golden Mean Ratio so that interpretation will be accurate and reliable.
The DPO formula removes the “trend” from the value of an index or the price of a stock, revealing the underlying current of cycles that normally exist hidden within the uptrend or downtrend. If a stock or index moves sideways for extended periods of time, the DPO may appear to be very similar due to the sideways nature of the price or value action.
Below is an S&P500 chart with the DPO indicator, which shows the cycles of the S&P500. Preceding every short term, intermediate term, and long term correction the DPO is showing a negative divergence, moving down while the S&P500 rises.
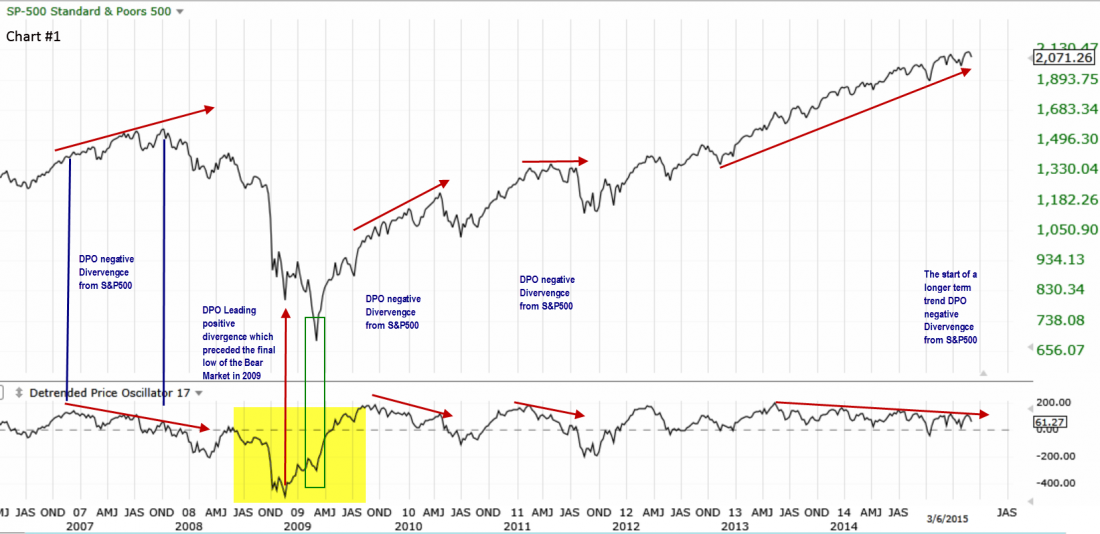
Using the DPO indicator is an excellent method of being able to anticipate when cycles are ending, and when cycles are beginning for the major indexes.
The highlighted yellow area on the chart shows that the DPO clearly indicated with an extreme deviation Cycle Trough the Bear Market was ending. The DPO tends to lead index action by about 3-5 months ahead of cyclical value Troughs and cyclical value Peaks. This allows ample time for technical traders and individual investors to make decisions about their trading or investments before the Trough concludes, and before the final speculative Peak action.
Whenever technical traders and individual investors can anticipate and be prepared for a cycle Peak or Trough, particularly extreme deviation patterns in cycles, then their decisions become thoughtful and accurate rather than reactive. Reactionary trading is how most technical traders lose money, while anticipatory trading eliminates the knee jerk reaction to events already underway.
What is important to remember about the DPO indicator is that it is a long-term analysis that provides leading indication of deviation in cycle patterns. It is not a Day trading tool, nor a Swing trading tool. However, this tool can be a huge help to Day and Swing traders when they learn how to exploit the extreme deviation Peaks and Troughs that the DPO exposes. The speculative velocity of an extreme Peak or the velocity panic of an extreme Trough are highly lucrative areas for Day, Swing, and Momentum technical traders. Just checking stock charts for extreme Peaks or extreme Troughs with the DPO can quickly give technical traders excellent stock picks to study for fast-moving price action.
For a stock, the analysis of the DPO tends to show more consistent cycles for many companies. Each company will have its own unique cycle length. There is no such thing as a “Four Year Business Cycle.” It all depends upon the products and or services, the complexity of the corporation’s business, its new technology development cycle, and other factors. Assuming every company has a “Four Year Business Cycle” will be hazardous to trading and investing profitability.
The most valuable analysis for a stock will be the major cycle deviations, which are either a Peak of the cycle or a Trough of a cycle.
Chart example #2 below is of the UnitedHealth Group, Inc. (NYSE: UNH) showing its first DPO extreme Peak deviation pattern as indicated by the red arrow.
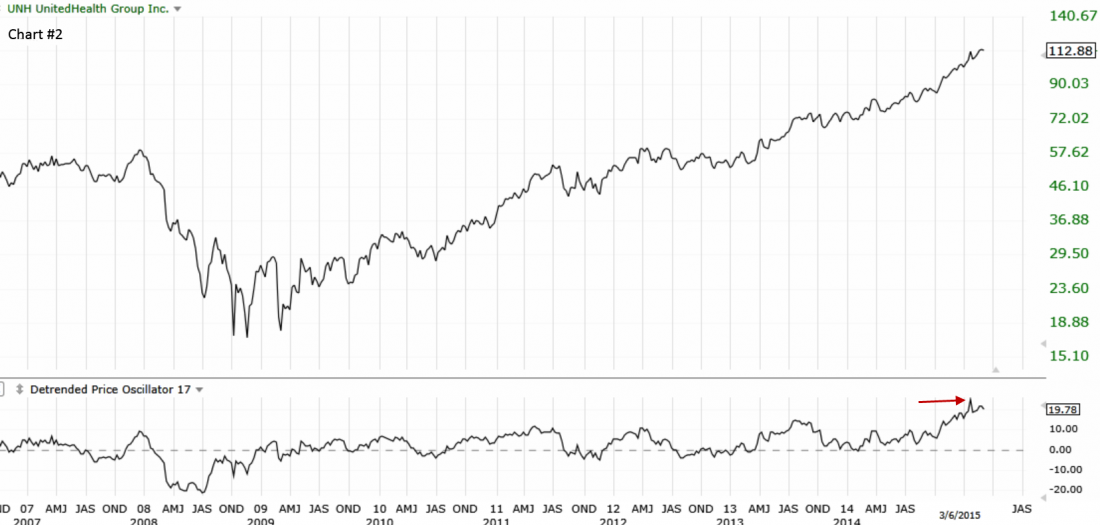
The cycle has deviated from its normal pattern and extended beyond the normal cycle timeline. The extreme Peak is likely to move even higher, before a final extreme Peak forms, which will warn that the stock has gone beyond fundamental and technical patterns. When a stock price first moves beyond fundamentals, this type of DPO pattern forms, and when a stock goes beyond technical patterns, the extreme peak then warns that the stock is at a rising risk of a major topping formation.
By contrast, chart example #3 below shows that Visa Inc. (NYSE: V) has an extreme Trough pattern and is not likely to fall below the prior low of January 2014, which was an HFT trigger sell off on the short-term trend. Thus, technical traders selling V short need to understand that the downside momentum is limited.
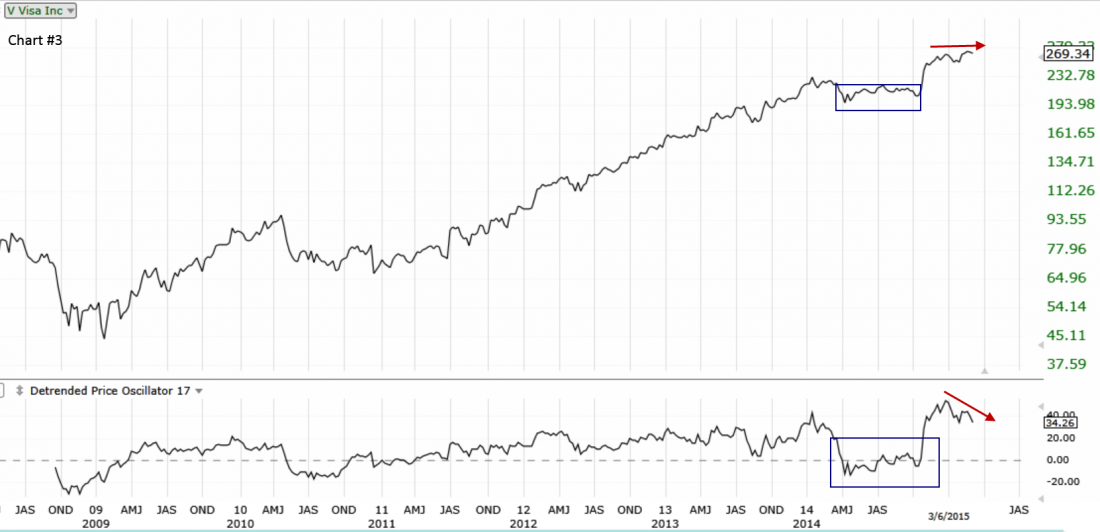
V has an extreme deviated Peaking pattern, even though price has shifted to a sideways pattern. What is exposed in this chart is the steady rotation of Dark Pools out of V without disturbing the price. The Dark Pool giant-lot orders are attempting to reduce shares held by the giant funds, and this lack of disturbing price is highly dependent upon uninformed, independent investors buying V at the peak high price to sustain this price level while the giants get out. It is a fragile pattern and the DPO is revealing that even though price has maintained, the stock is vulnerable should independent investors fail to buy more shares.
Summary
Cycle analysis is relevant and important for both technical traders and independent investors.
Technical traders can use it to find stocks that will encounter higher velocity and speculation in the near term, to determine final topping patterns before the patterns are clearly visible on the chart, and to find bottoms before the bottoms complete on the daily charts. The more versatile technical traders are with the analysis tools they understand and use, the better their trading results will be.
The DPO indicator is highly useful for long term analysis that will impact short term action. Using the DPO requires an understanding of what the indicator is designed to do, which is to reveal the invisible cycles present within a trend. These invisible cycles include Peaks, Troughs, Extreme Deviations of Peaks or Troughs, Broken Cycles, Reverberations within Cycles, Failures to Peak, and Failures to Trough.
Trade Wisely,
Thank You For Reading My Article
*TechniTrader technical analysis using a Stockcharts chart, courtesy of Stockcharts.com
#####
Related Reading …
Advanced Bollinger Bands® Techniques – More Variations Than Most Traders Realize
Disclaimer: All statements are the opinions of TechniTrader, its instructors and/or employees, and are not to be construed as anything more than an opinion. TechniTrader is not a broker or an investment advisor; it is strictly an educational service. There is risk in trading financial assets and derivatives. Due diligence is required for any investment. It should not be assumed that the methods or techniques presented cannot result in losses. Examples presented are for educational purposes only.

