

Last week, strong job numbers triggered a sell action in the market on the fear of an announced rate hike that might be coming from the Fed meeting on Wednesday. Some believe that the news is already priced in.
So, whether they decide to increase rates in June or September, it will inevitably happen, especially with the economy improving and with better than expected February job numbers.
The FOMC meeting on Wednesday will bring clarity and the market should pick a medium-term direction.
TECHNICAL LEVELS AND ANALYSIS OF MAJOR MARKET INDICES
QQQ
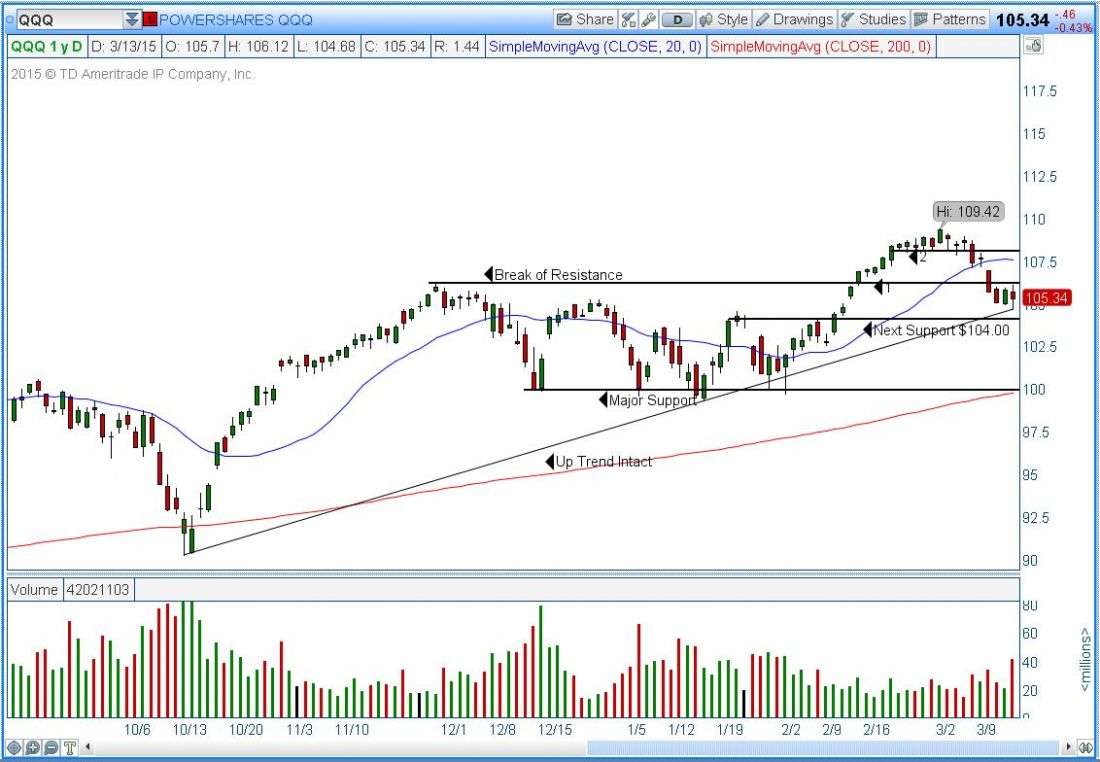
The large steep correction from the beginning of the week placed the QQQ back in a range for the last three trading days of the week. The QQQ is still in an uptrend. Moving into next week, the catalyst will be the FOMC in picking the direction. Here’s the game plan.
1. If the QQQ breaks the $104.00 level of support, there will be a wider void to fill all the way back down to $100.00 (quadruple bottom), and this will come as a very bearish move that would possibly change the trend.
2. If the QQQ bounces from this retracement area, where it has found support for the last three trading days of last week, a trigger over $106.40 can propel the QQQ back into an uptrend, thus testing resistance in the $108.00 area and continuing to test the yearly high of $109.42.
- Bias: Neutral
- Support: $104.50, $104.00, $102.50, $100.00
- Resistance: $106.25, $108.00, $109.42
Daily Chart of QQQ below represents the ETF’s trading activity until Friday’s close
SPY
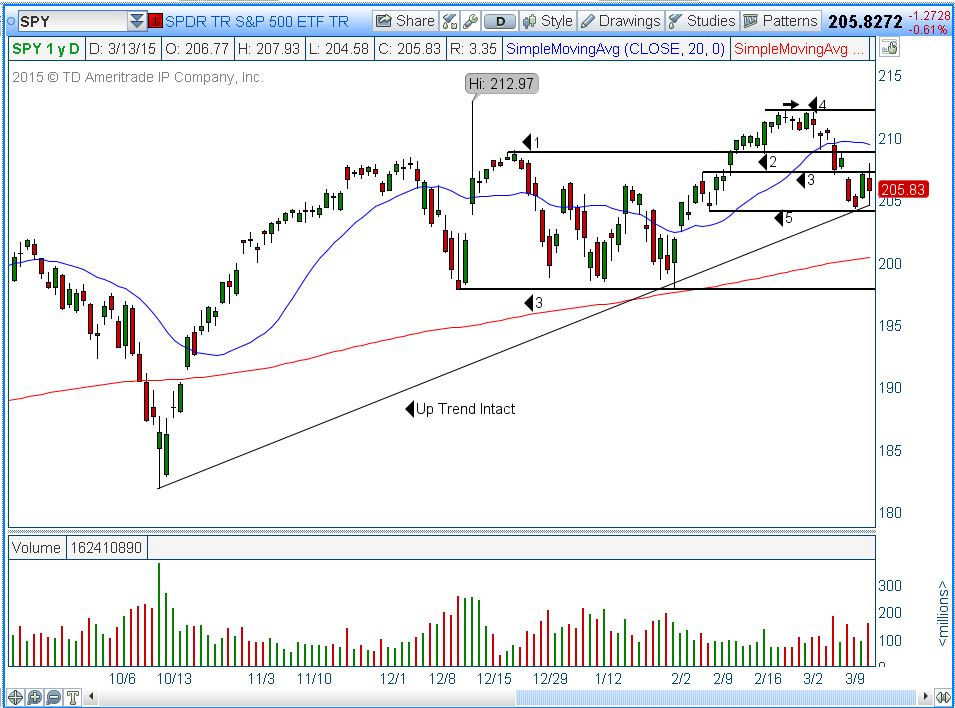
A far more violent drop than the QQQ last week, the SPY tested support area at $204.00 (area 5 on the chart), from which it bounced. If this support level holds, this move could ignite another continuation higher (through resistance area #3 on chart), and if it should break it, a revisit to the $200.00 level would seem inevitable, taking into consideration the fact that there is no other support area.
- Bias: Neutral
- Support: $204.00, $200.00, $198.00
- Resistance: $208.00 (area 3), $208.85 (area 2) , $212.00(area 4)
Daily Chart of SPY below represents the ETF’s trading activity until Friday’s close
Watch of the Week
The Stock
Forex Capital Markets (FXCM) is an online foreign-exchange market broker based in the United States. The company provides services through its own online trading platforms and through third party platforms, such as MetaTrader 4.
Technical Pattern
Shares of FXCM, one of the largest retail currency brokers in the world, were suspended on the New York Stock Exchange on Friday Jan 15, 2015 after the company said client losses on Swiss franc trades threatened to put it in violation of regulatory capital rules. The stock gapped down and has been basing since then. For the first time since then, FXCM came back to life with an influx of volatility in Friday’s trading session, perhaps a sign that it is ready to break higher.
The Trade
- FXCM long over $2.60,
- Stop under $1.80,
- Targets: $4.91, $7.19, and pretty much void into the gap fill.
- Risk: $0.80
- Potential reward at ultimate target: at least 8-10 R if it gets started.
Technical Picture 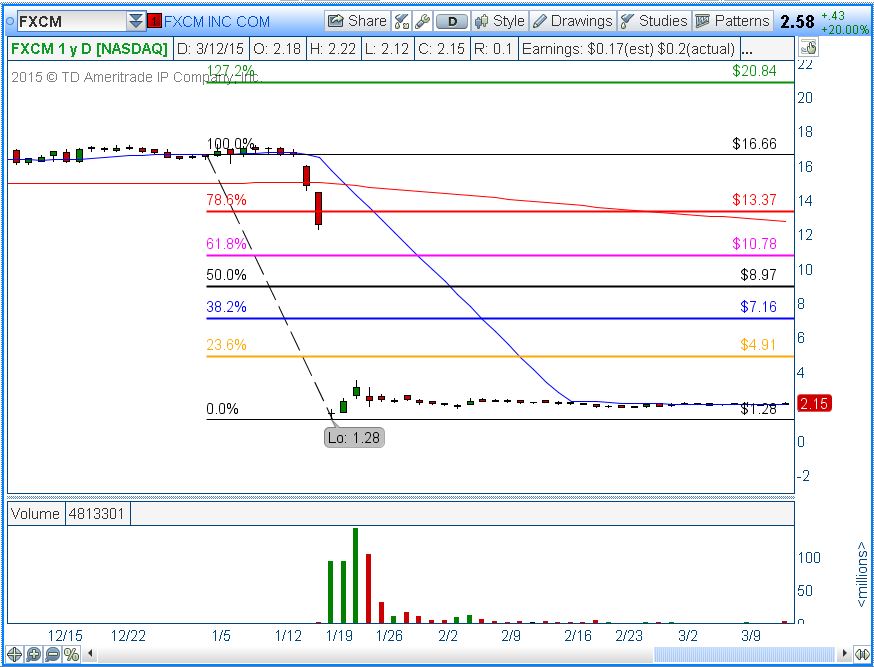
#####
For more information on Anka Metcalf and TradeOutLoud, please click here.

