

* I apologize for the interruption in daily updates. I’ve been on a tennis vacation in Indian Wells.
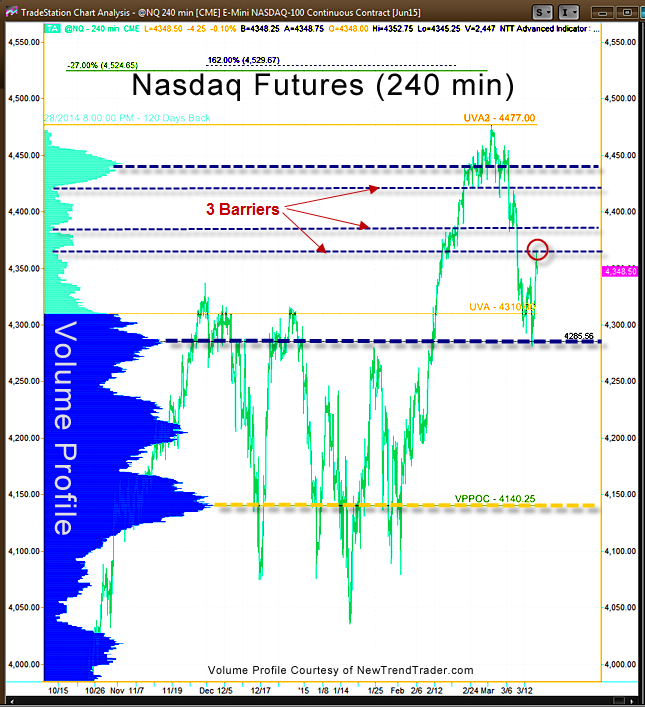
Last week the Nasdaq 100 (NQ) found support just below the 4290 level, which was identified as key support in the 3/09 update. This support arises from an important High Volume Node (the thick blue line on the Volume Profile chart). That’s the good news.
There are three small barrier levels above us indicated by thin blue lines at Low Volume Nodes (LVN). The lower of the three barriers stopped the price action on Monday. As previously mentioned, LVNs exert a more powerful force in the market than one might expect. Low Volume Nodes are price levels where very few traders have been interested in transacting business.
The NQ will have to work hard to traverse this low-volume mine field. Moreover, the month of March has a reputation for killing rallies. If the surge fails, then the High Volume Nodes at 4200 and 4140 are the next targets. 4140 is the Volume Point of Control over the last 6 months. In other words, it’s a very significant level.
A Note on Volume Profile
The histogram on the left side of the chart shows the volume distribution in the S&P futures for different periods of time. Key support and resistance levels are indicated by the peaks and troughs.
#####
If you would like to receive a primer on using Volume Profile, please click here.

