

Yesterday
After the hurly-burly of Quad Witching Week, Monday’s price action (Mar. 23) was almost tranquil – until the last hour. The futures recovered most of the losses from Friday’s slam-the-close finish in the overnight trading, and all of the loss before the first hour was out. After that, there was excitement in other markets, but the futures traded inside a three-point range on volume so slender that dust was settling on the quote terminals.
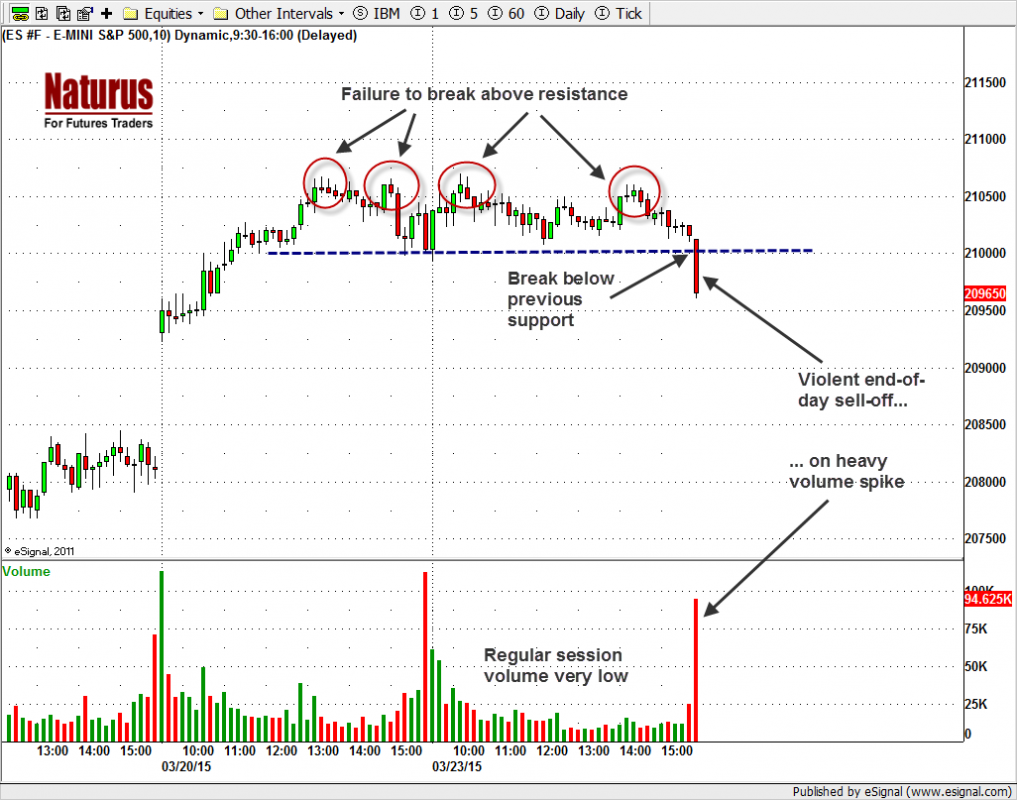
And then, around 2:30, the prices started to slip. Then they bounced a little, but not enough. Then they slipped some more, and then some more, until, in the final five minutes, there was flat-out panic selling, with no buyers until the shorts covered their positions and we got a little dead cat bounce off the lows of the day. The close was 2094.75, about five points below Friday’s close and 12 points below the high made within an hour of the open.
The price action was bearish, with no hint of the Plunge Protection Team riding to the rescue. The futures have now made two determined attempts to break through the resistance at 2106-07, and fallen back sharply both times. The intraday chart (see below) illustrates the kind of price action that makes the Bulls start looking for the exits.
Today
We see two things in the daily chart that bear watching (no pun intended). The first is the possibility that a double top is forming around this area. The ES has stalled just below the March high, which is where the initial March sell-off began, and those lower highs are holding the ES down.
The second is the lack of upside momentum and the absence of any interest in pushing up to new highs, as seen in the feeble volume. This is going to discourage the buyers, and keep some of the Bulls – the ones who haven’t folded already – sitting on the fence.
The key level for the upside will be around 2110-2108. If the ES can’t break above that point the Bears are going to start thinking that a short-term move back to 2050 is possible.
On the downside, the key level will be 2025. If there is a move below that area it will confirm the double top pattern, and we will then be looking for a further decline.
One step at a time …
For today, a break below 2092.75 will trigger downside momentum and push the price down to 2082.50-79.50 (long entry) to fill the gap. Conversely if there is a break above 2108.50-10.50, a little squeeze up to 2115.50-20.50 (short entry) should be expected.
- Major support levels: 2081.25-82.50, 2062-58, 2035.50-33.50, 2028-29;
- Major resistance levels: 2107-08, 2118.50-21.50, 2128-35.50
ESM5 Intraday Chart (10-minute bars), Mar. 23, 2015
#####
Naturus.com publishes a free weekly analysis of US equity indices. To get on the mailing list to receive it, please click here.

