

As noted yesterday, the stage was set for a pullback in the major indices. The Nasdaq 100 behaved much better than the large caps, however, and the Small Caps were actually up on the day. This bodes well for a continuation higher after some obligatory housekeeping.
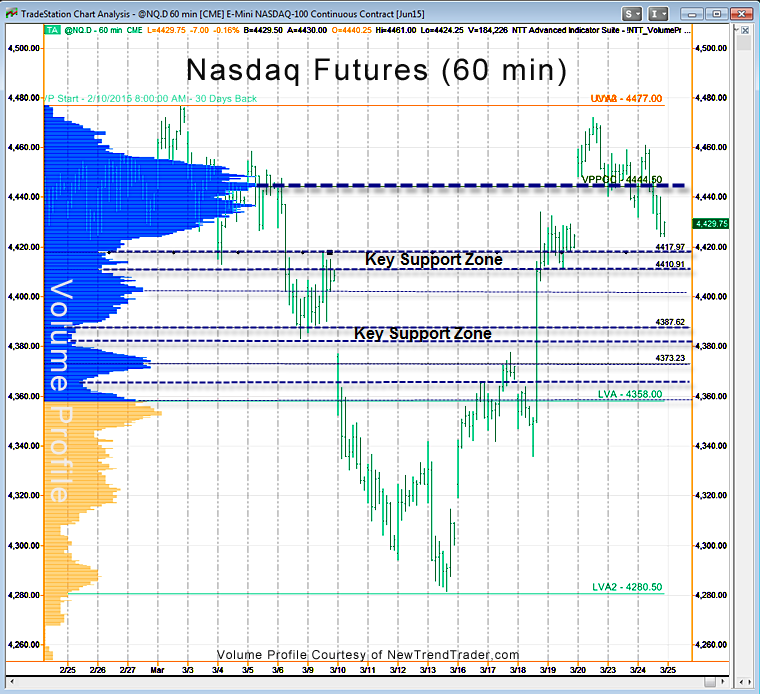
This is a Volume Profile chart of the day session in the Nasdaq Futures, to show the gaps. Corrections in the indices in an uptrend are usually about filling gaps (areas of irrational exuberance).
On Tuesday the Nasdaq Futures closed a gap from 3/19-3/20 in the 4430 area, which is a good start. Real volume support doesn’t come in until 4410-4417, however, so I’ll be looking for a bit more downside Wednesday morning.
While high volume nodes are always important price magnets, in the futures “stealth support” is often generated by low volume nodes.
A Note on Volume Profile
The histogram on the left side of the chart shows the volume distribution in the S&P futures for different periods of time. Key support and resistance levels are indicated by the peaks and troughs.
#####
If you would like to receive a primer on using Volume Profile, please click here.

