

I forecast “a little more rain,” but traders on Wednesday encountered a hurricane of selling. And I don’t think it is over.
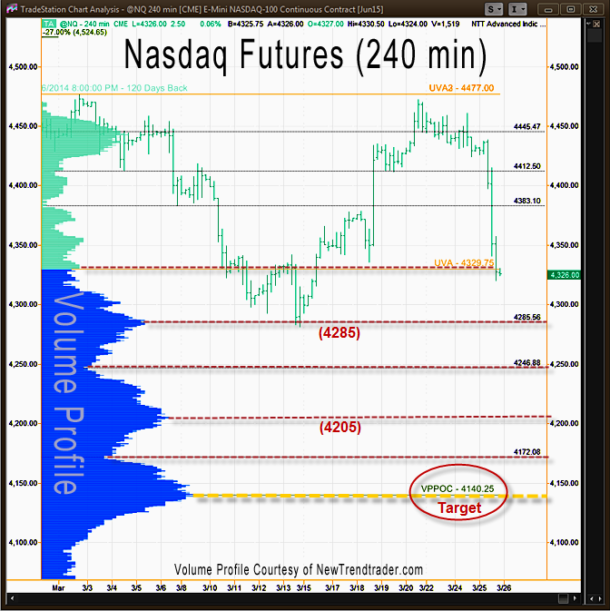
Yesterday, I published a Volume Profile chart of the day session in the Nasdaq Futures to show the gaps, which act as targets in more serious corrections.
The next gap to fill is at 4314.75, but the two more lie nearby at 4292 and 4210 (not shown on this chart).
While a bounce is possible at any time, I expect these gap-fill levels to be attained. 4210 coincides with a High Volume Node, so it is a highly likely target. The Volume Profile Point of Control (VPPOC) for this chart, which looks back almost an entire year, is at 4045. I consider that level a ‘final’ target for some time in April or May.
A Note on Volume Profile
The histogram on the left side of the chart shows the volume distribution in the S&P futures for different periods of time. Key support and resistance levels are indicated by the peaks and troughs.
#####
If you would like to receive a primer on using Volume Profile, please click here.

