

Yesterday
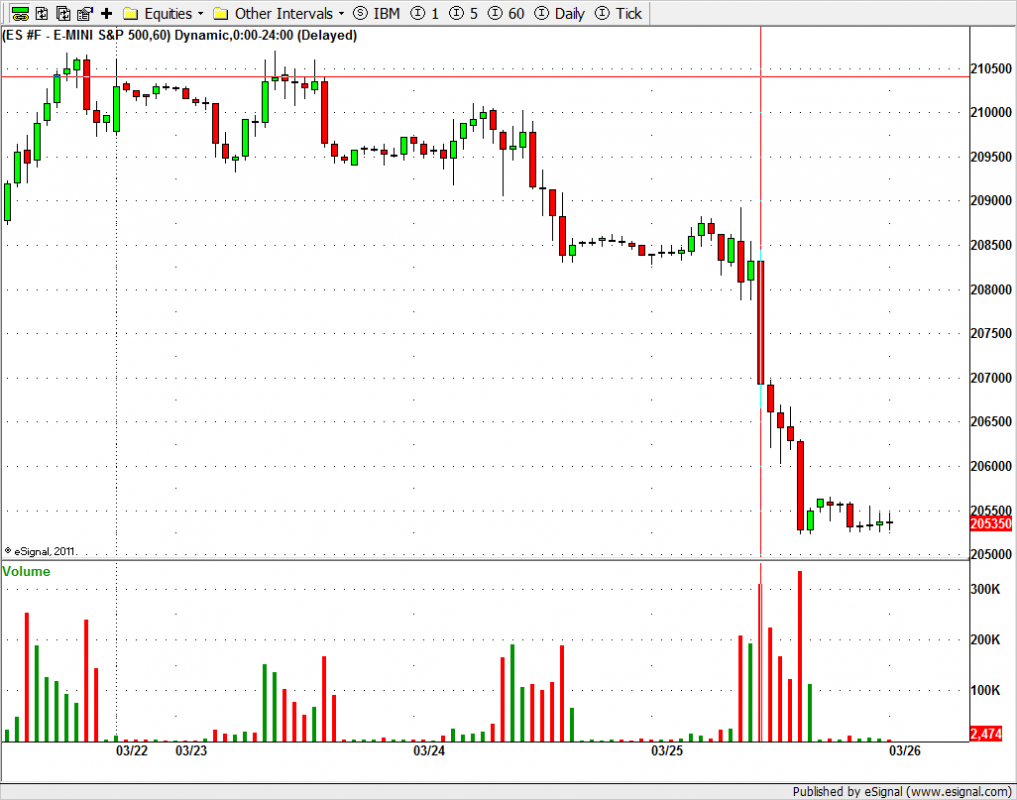
The S&P 500 mini-futures (ESM5) had a strong down day yesterday (Mar. 25) and settled at the bottom of the daily range again, the third day this week that it has failed to show a late-afternoon rally. The futures closed at 2053.75, 31 points below the previous close, on heavier volume.
The ES moved moved step-by-step to test each of the breakout points established by last week’s FOMC rally: 2078-76.50, 2064.50-66.50 and 2057.50-59.50. Those levels slowed the selling pressure, but only temporarily. None were able to keep the ES from falling. The price action was bearish all day.
Today
The selling looks like end-of-quarter re-balancing by fund managers, but selling is selling. Today we are likely to see a continuation low move in the early sessions, possibly with a bounce later.
Earlier we reminded traders about a possible bearish double top pattern forming on the daily chart. Now it is more clear to us the this pattern is in play. The neckline is lying around 2021.25. Before we get to that point the 135-day moving average line could act as support again; it has been holding ES up for the past four months.
Today we expect the sellers may cover their positions around the 135-day moving average line and push price up to anticipate Friday’s GDP report. But as long as ES stays under 2075-65 for closing, the short-term outlook will remain bearish.
- Major support levels: 2035.50-33.50, 2028-29, 2015.50-14.50, 2004.75-06
- Major resistance levels: 2088.75-89.50, 2107-08, 2118.50-21.50, 2128-35.50
ESM5 Intra-day Chart, 60-minute bars. Mar. 25, 2015
#####
Naturus.com publishes a free weekly analysis of US equity indices. To get on the mailing list to receive it, please click here.

