

A capitulatory opening gap down on Thursday was repaired after our initial 4285 target was attained (see yesterday’s forecast).
The “trick” with using Volume Profile effectively is to experiment with look-back periods in order to get a semi-Gaussian distribution. That means a volume distribution with a clear central peak and “shoulders” on either side. The 90-day look back in the NQ does the trick.
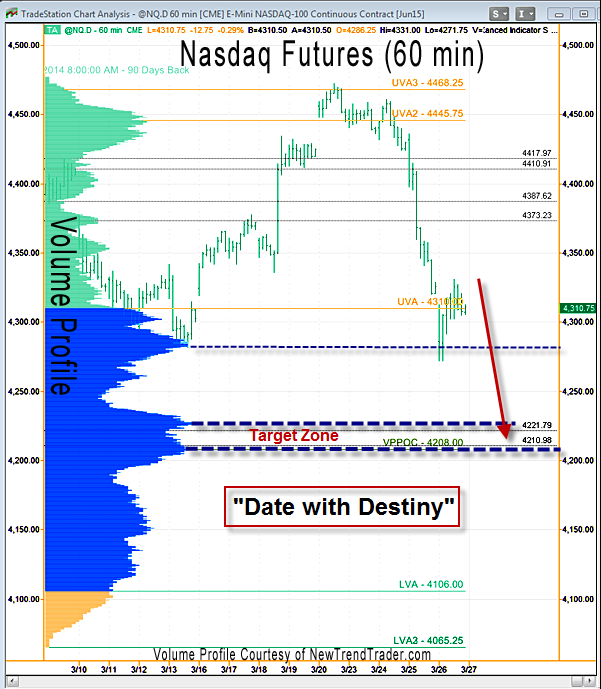
As mentioned yesterday, the 4210 area, which is the Volume Profile Point of Control (VPPOC) for this profile, also coincides with an unfilled gap. While a bounce of unknown proportions is to be expected here, the NQ has a date with Destiny at 4210.
A Note on Volume Profile
The histogram on the left side of the chart shows the volume distribution in the S&P futures for different periods of time. Key support and resistance levels are indicated by the peaks and troughs.
#####
If you would like to receive a primer on using Volume Profile, please click here.

