

Yesterday
In Monday’s note, we mentioned 2100 as an important psychological resistance level for the ESM5, the S&P 500 mini futures, and warned that a failure to break through that level might send the price back down to Friday’s low.
Bingo.
In yesterday’s trading (Apr. 13), the futures banged up on the open in what looked like panic buying, then stopped one point above the resistance before crawling back down to close at 2086.50, the low of the day and a couple of points above Friday’s low.
Despite yesterday’s weak close, the ES has made higher highs and higher lows for the past four days. But the close Monday was almost exactly where it closed two trading days ago. Lots of activity, but no progress.
Today
The failure to follow through on Friday’s run up tells us the rally had more to do with the weekly option expiration than riotous happiness about the market.
The recent lows now need to hold the futures up to give the market a chance to make another new high today.
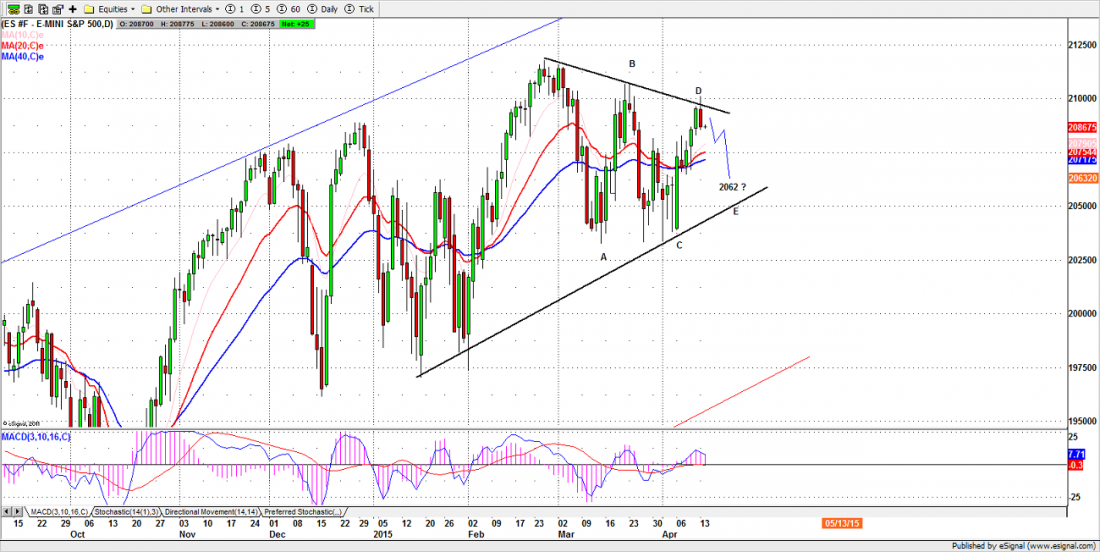
But there is another possible outcome. We have been looking at a potential A-B-C-D-E pattern on the daily chart, which implies a further decline to the E low around 2065-60.
Monday’s sudden stall in roughly the area of the D high (see chart) keeps that possibility alive, but doesn’t guarantee it will work out.
Two things have to happen to validate that pattern – the rally can’t move very far past Monday’s high at 2101.25, and the decline has to break down past strong support around 2075-70.
It will take some truly terrible news event to break that support, and if it is not broken, the market is likely to continue up.
A move above 2105 will breach the pattern and push the price up to 2115-20 to test the March high.
- Major support levels: 2062.50-64.50, 2055-56.50, 2045-43.25
- Major resistance levels: 2100-2099.50, 2107.50-08.50, 2117.25-21.50
ESM5 Daily Chart – Apr. 13, 2015
#####
Naturus.com publishes a free weekly analysis of US equity indices. To get on the mailing list, please click here.

