

Having gotten through the first quarter of the year, let’s just take a quick look at where we stand with interest rates. The lows in yields were made in late January, 1.16 for the Five-year Treasury bond, 1.64 for the Ten-year bond, and 2.22 for the Thirty-year bond. Then the employment release in February sent yields on an upward trajectory, and the March jobs data marked the high yields for the year so far – 1.70 for the Five-, 2.24 for the Ten- and 2.84 for the Thirty-year bond. So the ranges for the year are 54, 60 and 62 bps, respectively.
Currently we are near the midpoints of those ranges, though the five and ten are actually nearer the lower boundary than the upper (as of yesterday 1.34, 1.90, and 2.55, respectively). However, the inflation indexed ten-year note, or TIP, is near the low of the year, having made the low of zero in late January, then surging to 43 in March and now back down to just 9 bps.
Throughout 2012 into the 2nd quarter of 2013, real rates, as defined by the TIP, were negative, suggesting rather stimulative financial conditions. A low or negative real rate pushes investors into riskier assets and, of course, makes borrowing cheaper for businesses. As Stanley Druckenmiller might note, these are the same conditions/policies that pushed us into the crisis in the first place.
Below is a chart of the Ten-year Inflation Indexed Note Yield, over the past five years.
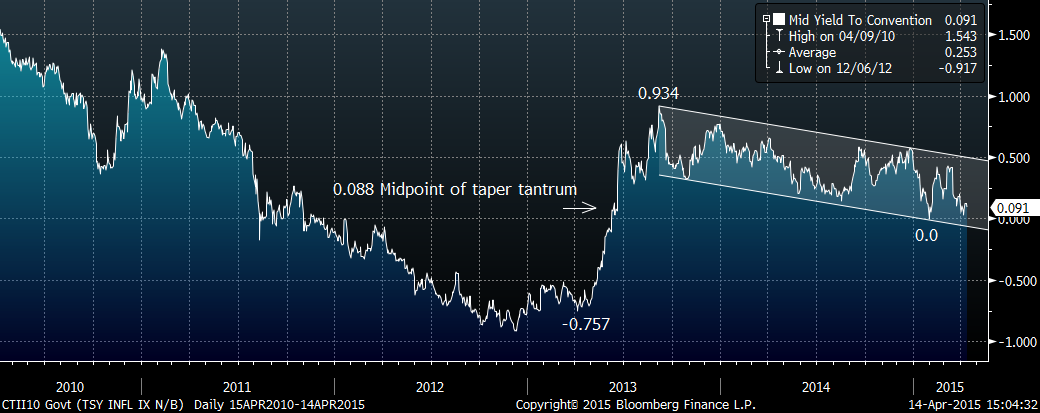
In Q2 of 2013, Bernanke suggested tapering QE purchases, and yields exploded. In fact, yields have now come approximately halfway back from the taper-tantrum surge. While the Fed steadfastly maintains that lift-off in the form of rate hikes is coming, the market is taking a “show me” stance. The data in Q1 has been disappointing on the downside, most recently with yesterday’s Retail Sales miss. Yields have retreated and the market has tempered the idea of rate hikes. European bonds continue to grind lower with the German 10-year Bund at only 14 bps.
Below is a chart of the US Five-year Treasury over the past five years.
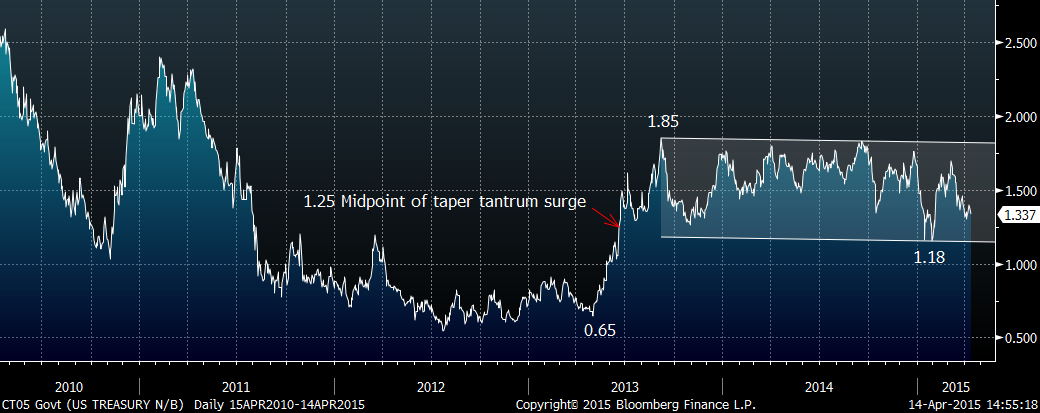
The move back to the middle of the year’s ranges suggest stable conditions and indeed implied volatility in the ten-year note has gone from over 6% earlier this year to beneath 5% as of yesterday’s close.
What is the short of it?
The treasury market seems to be on the same page as the Fed – a “show-me” posture is essentially the same thing as saying “we’re data dependent” (the Fed’s message), though the longer end of the treasury curve is still biased toward lower rates.
#####
For more information on Alex Manzara, please click here.

