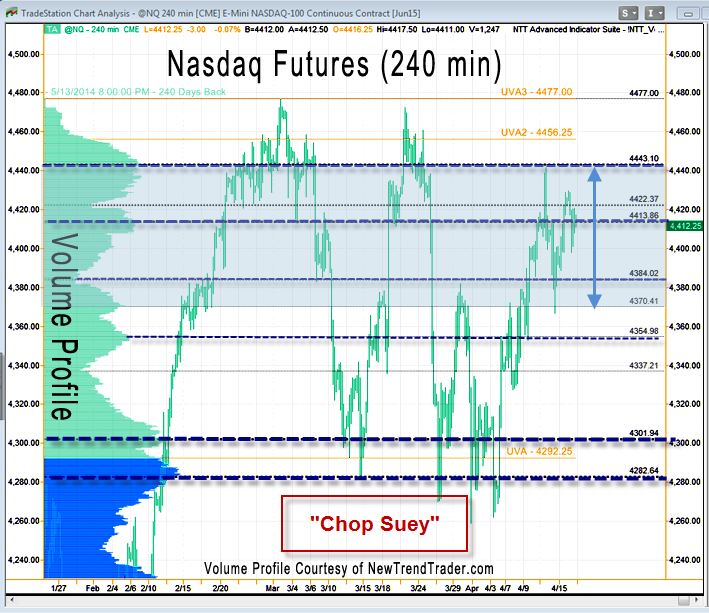
This is a chart of the Nasdaq futures over the last two months. While the index has presented tradable moves in both directions, the overall picture is one of a choppy and volatile consolidation.
As noted yesterday, the fast moves create Speed Zones that eventually beget sudden reversals, trapping bulls and bears alike.
The shaded blue area marks the current active consolidation range. Think of it as a bottle with a fly buzzing around inside trying to get out. The NQ closed on Thursday at the (thick) 4413 line, which is a High Volume Node. That means it’s a popular “street corner” where lots of traders like to transact business.
The two thick lines (4413 and 4443) are the upper controlling levels at this time. 4384 is a Low Volume Node and should halt any tactical sell-off.
A Note on Volume Profile
The histogram on the left side of the chart shows the volume distribution in the Nasdaq futures for different periods of time. Key support and resistance levels are indicated by the peaks and troughs.
#####
If you would like to receive a primer on using Volume Profile, please click here.